Sometimes it’s better to ignore the volatile fluctuations and noises in lower time frame and pay attention to market activity on higher time frame charts, especially when trading market trends. The guideline will prove very much useful when the stock under consideration is from a high beta sector such as Energy, Metals, and Pharma etc. High beta stocks tends to fluctuate a lot in lower time frame, so it’s quite common to miss the large price movements and trends when you’re completely lost in the noises of lower time frame.
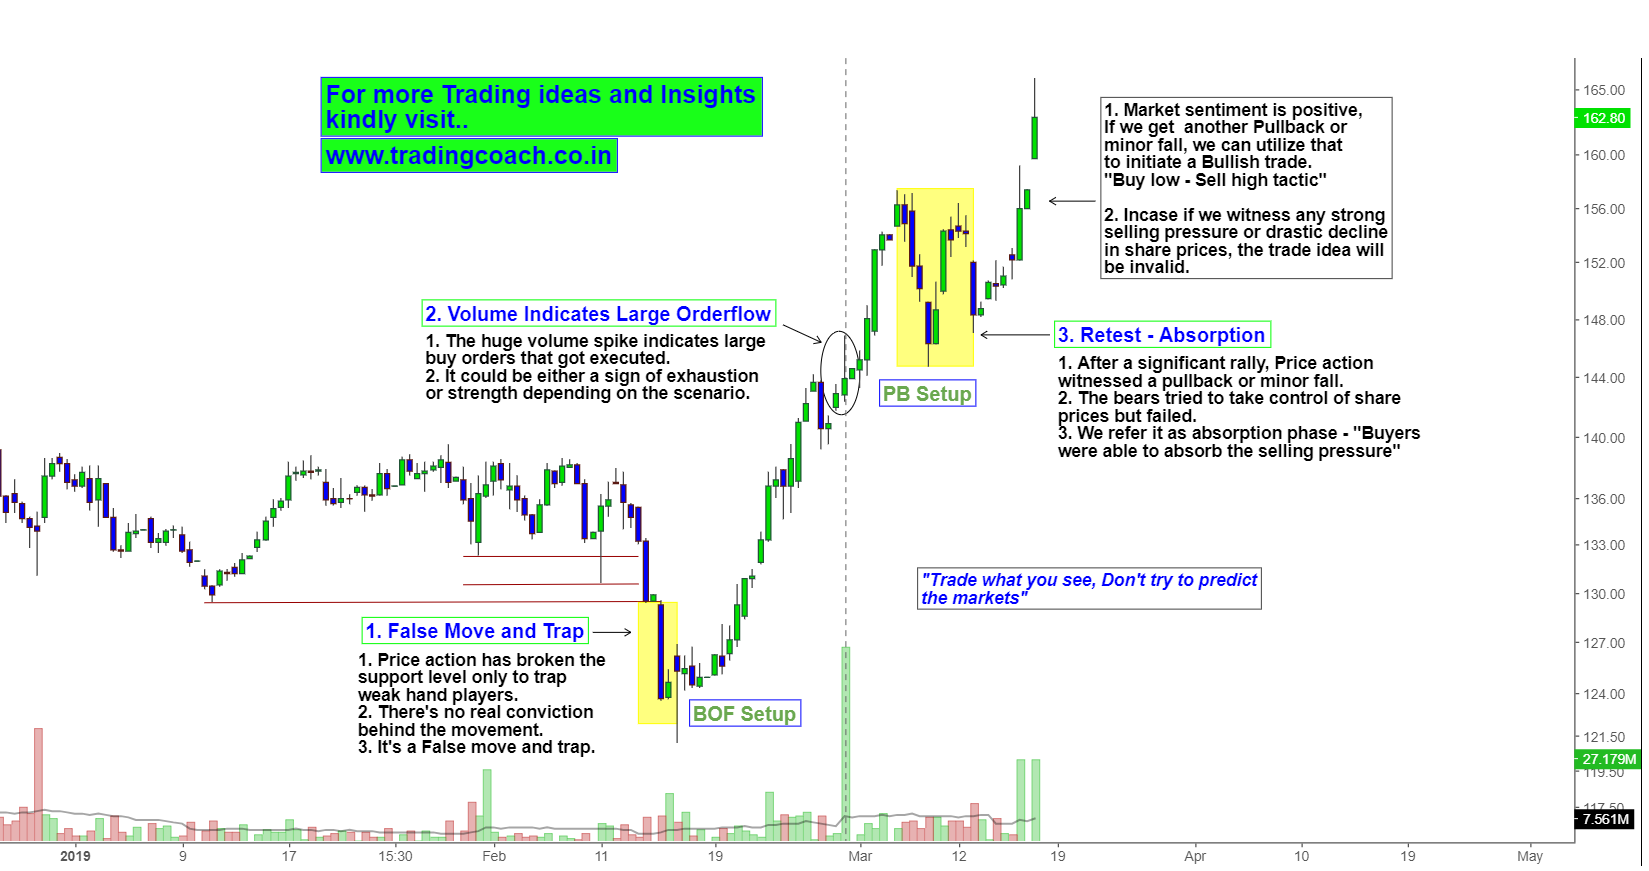
Such is the case with IOC – Indian Oil Corporation. The stock price of the largest commercial oil company in India has rallied from 124 to 165 in less than a month. That’s almost around 30% gain from Mid-February to till date. If you’re like most of the short-term traders who ignore the higher time frame price action, there’s a high possibility you would’ve missed to notice this entire rally.
Price Action Trend Analysis on the Daily chart
An effective solution is to make it a habit of paying attention to higher time frames such Daily and weekly charts. It doesn’t matter whether you’re Day trader, Swing trader or Positional trader – It’s good to at least have a glance at higher time frame market behavior every now and then. Doing so will help you to spot large market trends and high probability trading setups.
Talking about IOC, we can see in the analysis that Bulls are in control of Market direction. The sentiment is positive and volume also clearly resonates with the sentiment on Daily chart. Just like the previous retest – absorption structure, if we get another pullback or minor fall within the trend, we can utilize that to initiate long trades. In case if we witness unexpected decline in share prices or prolonged consolidation then we must reconsider our analysis and trade idea.
Just like with any Price action approach, it’s good to trade what you see instead of trying to predict the markets. So simply focus on the trend in Daily chart and take trades accordingly.


