ITC is a popular choice for both domestic and international investors due to its reputation.
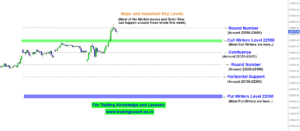
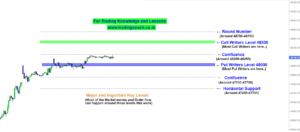
The stock has recently rallied from 327 to 392 within a month despite negative market sentiment, resulting in an 18% return so far. Currently, the stock is trading within a range and is testing its support zone at around 380, with parallel resistance at around 400.
ITC Price Action Analysis on 4h Chart
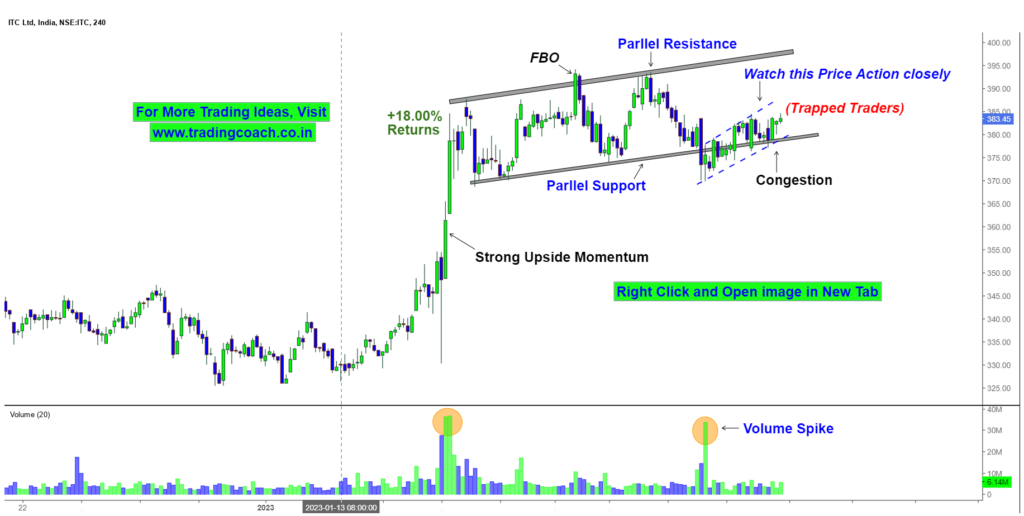
Right now, prices are testing the support zone and have formed congestion around this key level, which indicates that a sharp breakout could happen soon. The volume has spiked up around the same time, further suggesting that the market is anticipating a significant move in either direction.
As there is congestion around this key level, traders and investors need to monitor the price action closely for a possible sharp breakout in either direction, which could result in a significant move.
A strong breakout could happen either on the upside or downside, to learn more about trading breakouts with the help of Price Action Strategy, checkout the video link given below. It is essential to keep a close eye on the price action to take advantage of the potential opportunities.