

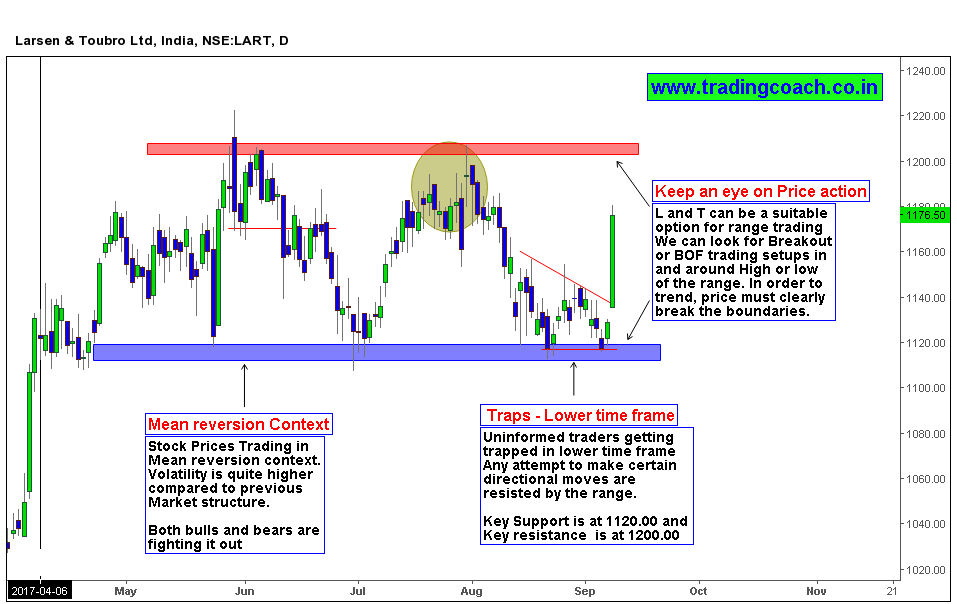
When we look at Price action in the daily chart of Larsen and Turbo ltd, it’s obvious to notice that stock prices caught in Intermediate range between 1120 -1200. The range is persistent since May 2016 and price behavior of L and T has attracted range – volatility algorithms primarily used by institutions. Price swings on both sides show us that, both buying and selling pressure is offsetting each other, resisting directional moves. Any trend based patterns or setups on lower time frame would likely result in improper Risk–reward or failures because of Mean reversion context we are witnessing in daily chart.
Uninformed traders are getting trapped by engaging in directional trades, we can spot the trap formations near key support (1120.00) and resistance (1200.00) zones. In order to trend, market prices should directionally break the key levels clearly and must retest it. Observe the Price action take trades according to developing market structure, Range traders and Positional traders can keep L and T in their watch list.


