Looks like we are experiencing more range bound behavior in Nifty 50. There’s a good possibility of volatility picking up even more in upcoming days.
When we look at the Price Action on Weekly chart, it’s clear that the Nifty 50 is trading within a corrective range.
Take a Look at the Price Action Outlook on the Weekly Chart of Nifty 50…
Nifty 50 Price Action Trading Analysis on Weekly Chart
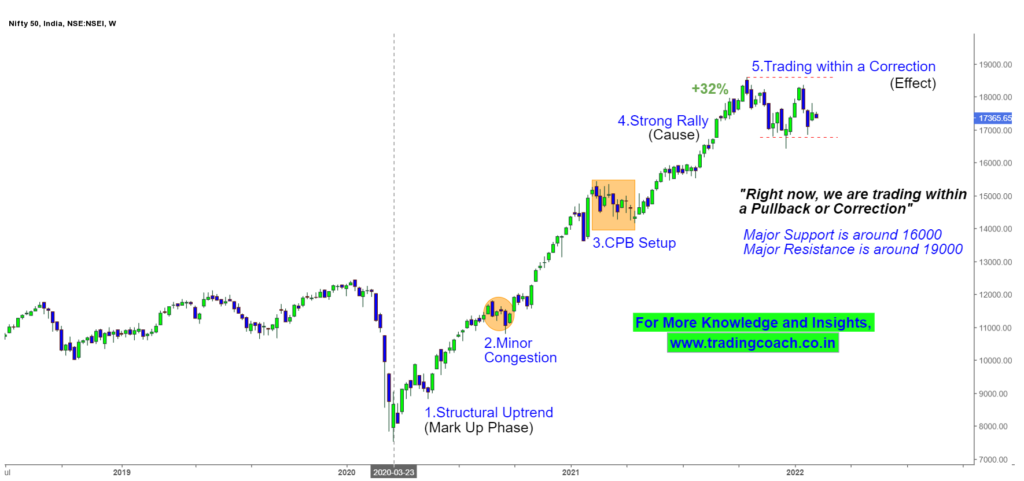
The correction which we are seeing right now is a result of Nifty 50’s previous rally from 14000 to 18000, during the period of April – Oct 2021.
Major Resistance is around 19000 and Major Support is around 16000, Price Action must clearly break and retest either one of the Zones for the market prices to trend.
To get even more clarity about Price Action, we can look at the Price Action in a lower time frame. That is the Daily Chart. Multi Time Frame Analysis can provide a much clearer picture of the overall Market Sentiment.
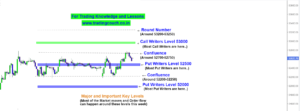
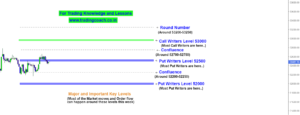
Take a Look at the Price Action Analysis of Nifty 50 on the Daily Chart…
Nifty 50 Price Action on Daily Chart
We can clearly observe the correction and range in the Nifty 50 on the Daily Chart.
Prices are bouncing back and forth from the zone of No Man’s Land. It’s better to avoid taking positions in the area, because of market traps and rejections.
Intermediate Resistance is around 18625 and Support is around 16585. Price Action might test these intermediate zones in the upcoming days.
Traders should keep an eye on the price action and be prepared for market volatility. Take positions as per the market sentiment with tight risk management.