On the Intraday timeframe Nifty was little volatile and showed some signs of selling pressure. But on Higher time frame, the story is completely different.
In 1D Chart, Nifty 50 is in a Downward Range. There’s a fierce battle between Buyers and sellers as we can see sharp price swings in both direction.
Prices are not yet out of the negative perception and sentiment. Most of the Stocks in NSE that forms the major part of Nifty 50 such HDFC, TCS, Reliance Industries are moving in a similar fashion.
Take a look at the Price Action of Nifty 50
Nifty 50 – Price Action Analysis in 1D Chart
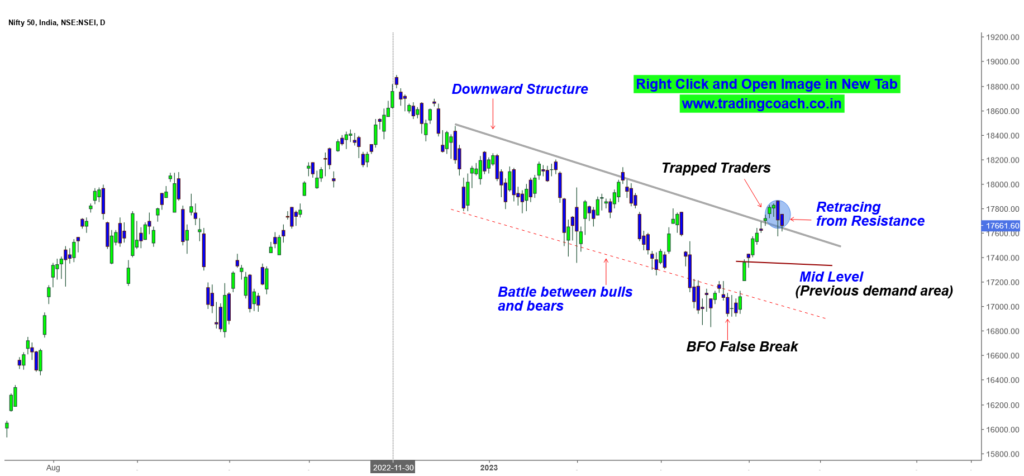
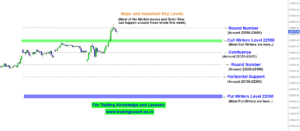
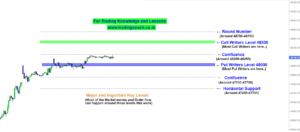
Market Structure is still indicating Bearish sentiment. Prices are retracing from the Parallel Resistance Zone at 17650.
Price Action is forming a False Breakout type pattern at the resistance; the behavior could’ve already trapped many uninformed traders.
My outlook is simple, I am expecting Nifty to fall or at least consolidate for a while. Prices could retest the Mid-level of 17375 – 17400.
However market could move in either direction if situations and circumstances change. To learn about how to trade simple false breakout rejections like these, checkout the video given below
What’s you outlook on Nifty 50? Where do you think it’s headed? Let’s discuss on comments