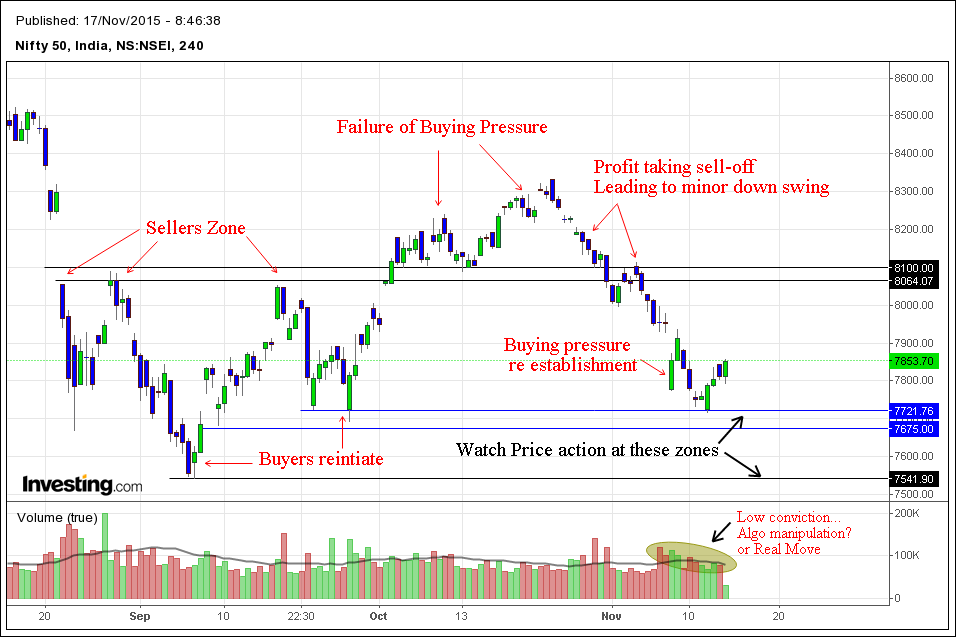
Quoted above is the 4h chart of Nifty. As you can see, I’ve marked my observations on the Price chart. The Seller’s zone which is around 8100- 8050 is holding firmly well. This is visible through multiple tests and Failures to break the resistance level.
The bearish swing which started at 8300 is a profit taking selloff, turned into a self-fulfilling down swing after a minor pullback around 8000. Now the Price is testing 7800 zone, where we can see the buying pressure taking hold. Also the same 7800-7700 zone has provided multiple supports to the bulls before. Recent Price action around 7721 confirms that, Buyers are still in control of the zone.
We can notice the volume structure which reveals either one of these two things:
1) There is no conviction behind Rising Price action or
2) Algorithmic activity seems to take control of Price action
It’s hard to make decisions on the Basis of volume. Especially, the long-term structure is still downside. As I have pointed in the article.
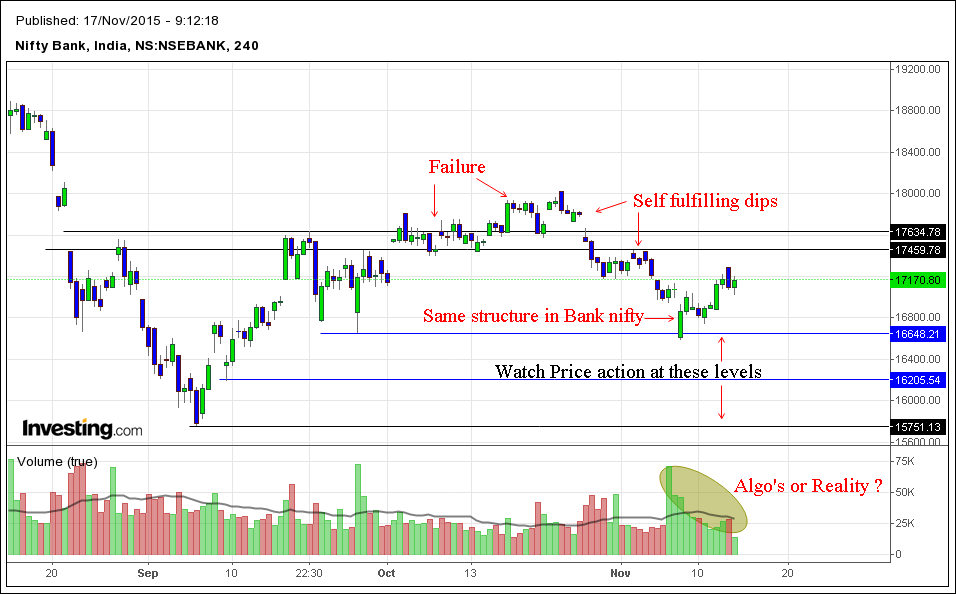
Bank Nifty seems to show the same structure with relatively few differences. Even volume is a copycat of Nifty. See the chart

What’s interesting is in fact, Bank nifty is leading the move towards upside. It’s ahead of Nifty in terms of Both Market structure and Price action. Look at the chart carefully, it’ll be obvious. Only difference between Nifty and Bank nifty is the Key levels.
Watch Price action around the Zones and make informed decisions. This is a corrective structure and we will see Price action oscillating on both sides. I am Neutral on both nifty and Bank Nifty. I’ll play on Price action setups and structures based on both sides. There is a time to be a bull and time to be a bear. But this time, we need to be both. Trade the Price action not opinions.


2 thoughts on “Nifty and Bank Nifty Market updates: November 17, 2015”
Superb
Best