

On Thursday, Nifty tumbled losing 130 points due to weak cues from global markets. In terms of fundamentals the focus rests squarely on ICICI Bank reporting its fourth quarter earnings today. Price action is trading within a range bound structure and investor sentiment is still cautious. Today’s price action may offer further clues about market sentiment. Current price value of Nifty is 7849.20.
Below is the hourly chart of Nifty with price action analysis and observations
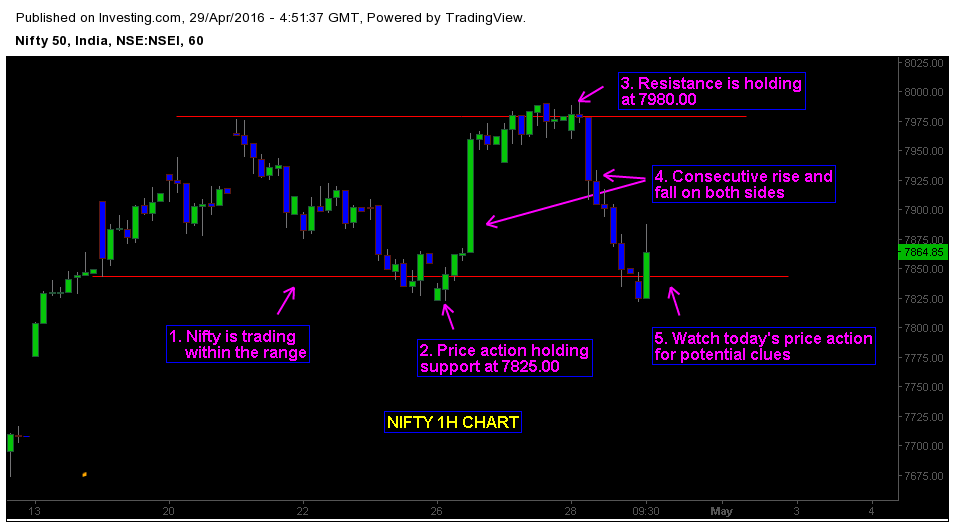
1. Nifty is trading within the Range
From past two weeks, Price action is trading within the range bound structure. Volatility is dominating the market sentiment. Consistent traps and breakout failures on Lower time frame resulted in good trading opportunities for contrarian traders.
2. Support is holding at 7825.00
Structural support level is at 7825.00. Price action rebounded sharply after testing the key level. It indicates that buying pressure exists thus we can logically conclude that bulls might try to defend this key level.
3. Resistance is holding at 7980.00
After testing the key level at 7980.00 Nifty lost 173 points. Global market worries and cautious investor sentiment is the main cause. Technically it tells us about the presence of sellers at structural resistance. Traders should watch the price action at minor resistance levels to evaluate the selling pressure.
4. Consecutive Rise and fall on both sides indicating uncertainty.
Uncertainty is influencing the price action in Nifty. With in last two weeks, we have seen both strong rallies and abrupt selloff. It is better to stay sidelines till market sentiment becomes clear. When you see the chart it becomes obvious that market is directionless.
5. Watch Today’s price action for potential clues
To get a better picture on Market sentiment, Traders should focus on today’s price action. For potential trading opportunities and setups keep an eye on Lower time frame. Monitor the support and resistance levels on daily chart.


