

Bulls are dominating the Nifty since last few days, from support level 6800.00 – Price is steadily rising. But looking from the perspective of daily chart, Nifty reveals some interesting information. It’s obvious to note that nifty is bullish since March 1st – shortly a day after Indian budget 2016. A day before the large bullish candlestick, we saw a huge rejection at support level 6800.00 (Look at the chart).
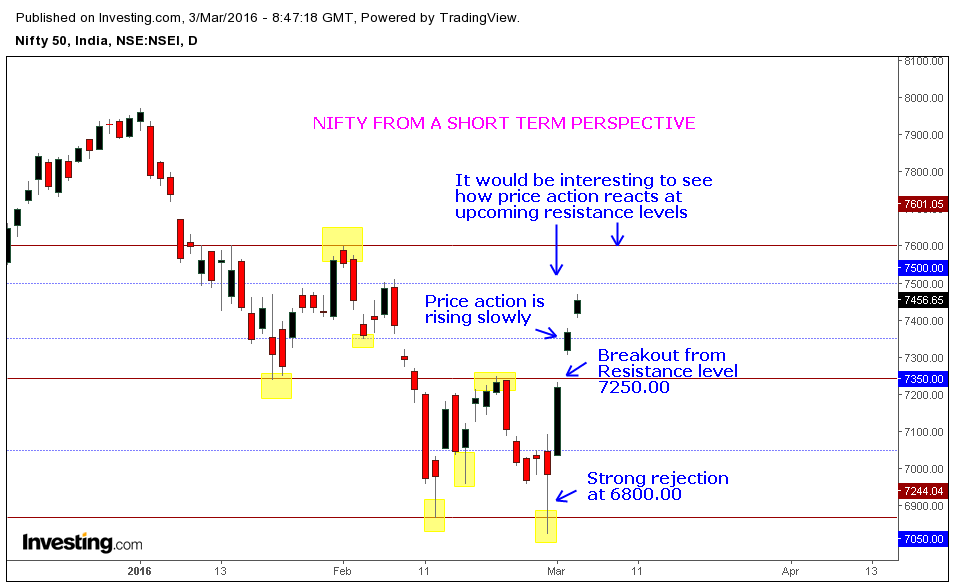
Now this price action at Feb 29th begs some questions! The current price rise in nifty – is it a valid bullish movement, accommodated by strong buying pressure or just a mere liquidation after the effect of budget? Leaving this question aside, let’s focus on the chart. We see a breakout at earlier resistance level 7250.00, breakout formation itself is exhaustion gaps followed by two small-sized bullish candles. This tells us that Price action is rising slowly, with some decent momentum. We should always evaluate the candlesticks along with the gaps, if they’re formed with the gaps.
Now the real tests for the bulls exist at upcoming short-term resistance levels – 7500.00 and 7600.00. If we see the price action breaking these resistance levels easily, then it would act as a confirmation that buying pressure is in control. Incase, if we see some large interruptions at these resistance levels or strong bearish candlestick formations, we can conclude that selling pressure is not over yet. Traders should focus on upcoming resistance levels and it will be interesting to see how price action reacts at these levels, it can offer cues on future Market direction.


