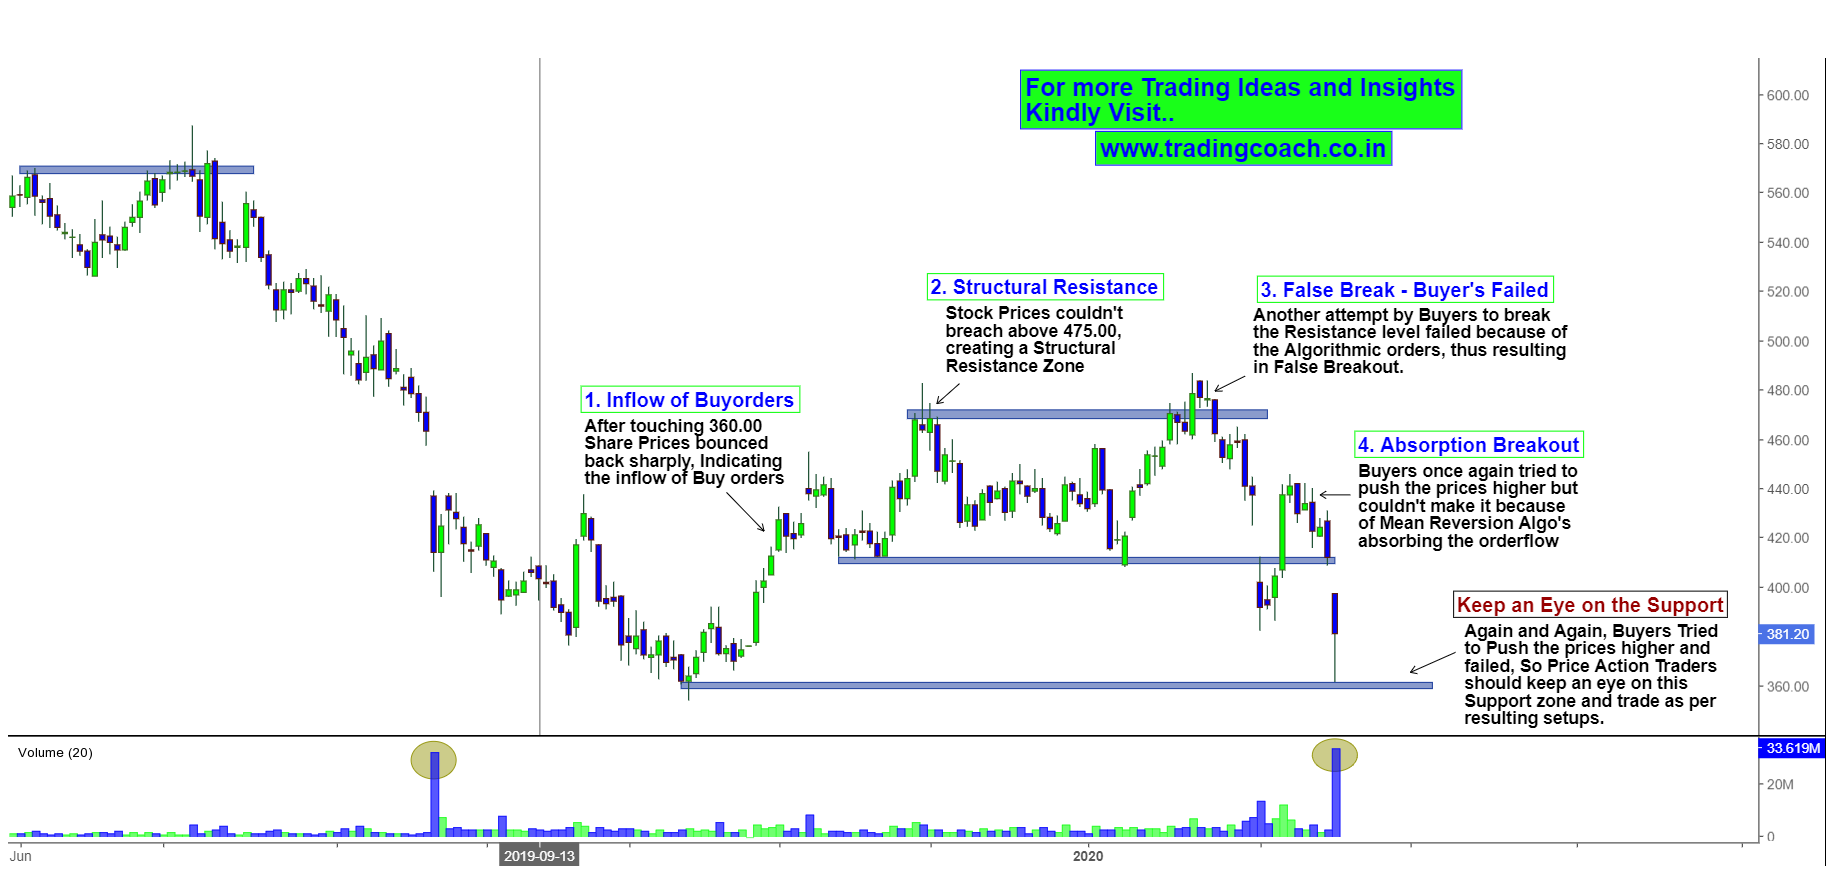
After sorting out some of the Stock charts during the weekend, I stumbled upon LIC Housing Finance. The Price Behaviour caught my attention, as there’s a serious tug of war going on between bulls and bears. In the lower time frame such as 15 Min, 30 Min and 1h, it may seem like Stock prices are moving in a downtrend but a precise observation on 1D chart reveals a different type of Price Action. Take a look at this analysis.
Price Action Trading Analysis on 1D Chart
It’s obvious to notice that Stock prices are actually trading in a Range / Sideways Market Condition. A deeper look at the Price Action that occurred in the Range reveals some interesting scenarios.
First and foremost, there are clear indications of possible algorithmic trading behavior going on in the stock. We can witness multiple rejections and prominent false breaks which are likely a result of Mean Reversion systems.
Another interesting factor is notice how buyers made multiple attempts to push the prices higher but couldn’t make it. Take look at the Absorption Breakout pattern – Prices bounced back sharply after touching the intermediate support at 415.00 but couldn’t follow through. It’s a good reflection of how Buyers defended the support zone but somehow failed to sustain the momentum.
All these observations show that tug of war between Bulls and Bears might continue even further and Stock prices could become more volatile as a result. To put it simply, overall it’s a two directional Market sentiment. Price Action Traders should keep their eyes on the Support zone at 360.00 as it’s an important decision point that could decide the future course of action.


