

Whether it’s Indian or global markets, some technical indicators are considered as foundation concepts. No Wonder, most traders in India use moving averages for buy and sell signals. Intentionally moving averages were created for the purpose of understanding Market action and Price dynamics. Trading Moving averages and their buy – sell signals, is a useless technique and it doesn’t works. Why? Because Moving averages are created for different reason, than they’re used. Price action traders utilize moving averages in a different way altogether; they don’t rely on moving average cross over signals, instead their focus is on understanding market structure and price action with the help of moving averages. In true essence, Moving average is a valuable technical tool if you know how to use it.
Read here to know what is Price action trading and whether it is suitable to apply in Indian Market…
Moving averages are widely used in practice of technical analysis. They are a basic tool with a broad set of uses. Price action traders use moving averages to find trend, to determine levels of support and resistance, to spot price extremes, climatic market movements, understand market structure etc. There are literally lots of ways; price action trading can utilize moving averages, I didn’t write all of them in this article due to Page limitations and time issues, but I do cover them in my Price action trading course.
Kindly checkout my trading course by clicking here…
Let’s look at three basic ways that price action traders use Moving averages.
TO DETERMINE MARKET TREND
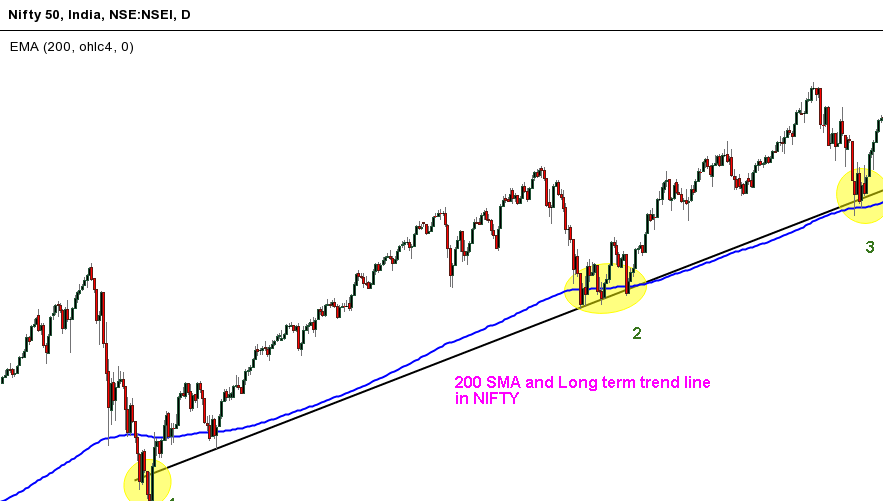
The most common usage is comparing the current price with the moving average that represents the investor’s time horizon. For example, many investors use a 200-day moving average. If the stock or market average is above its 200-day moving average, the trend is considered upward. Conversely, if the stock or market average is below the 200-day moving average, the trend is considered downward. Moving average tends to follow the trend line fairly well. The moving average then becomes a proxy for the trend line and can be used to determine when a trend is potentially changing direction, just as can a trend line. In the chart, for example, the later prices have held at both the trend line and the moving average. Take a look at the Nifty chart below.
TO DETERMINE KEY SUPPORT AND RESISTANCE LEVELS
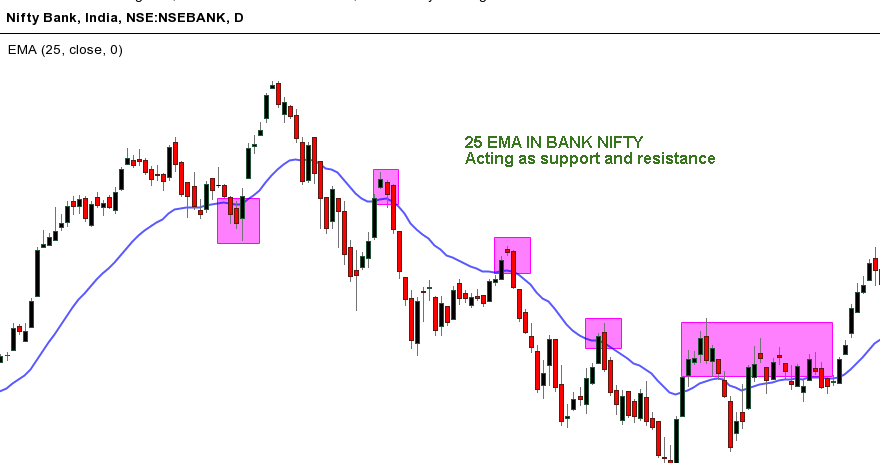
The moving average often acts as support or resistance. As you can see in the chart of Bank Nifty at bottom, moving average often acts as support and resistance; therefore, it can be an easy trailing stop mechanism for determining when a position should be liquidated or reduced. In addition, price action seems to reverse when it touches the curve of moving averages. Most market participants such as floor traders, Institutional investors use moving averages to time their entries and exits, this maybe the reason moving average acts as support and resistance.
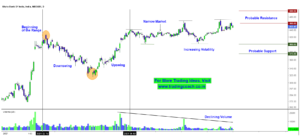
IDENTIFYING PRICE ACTION EXTREMES AND CLIMAXES
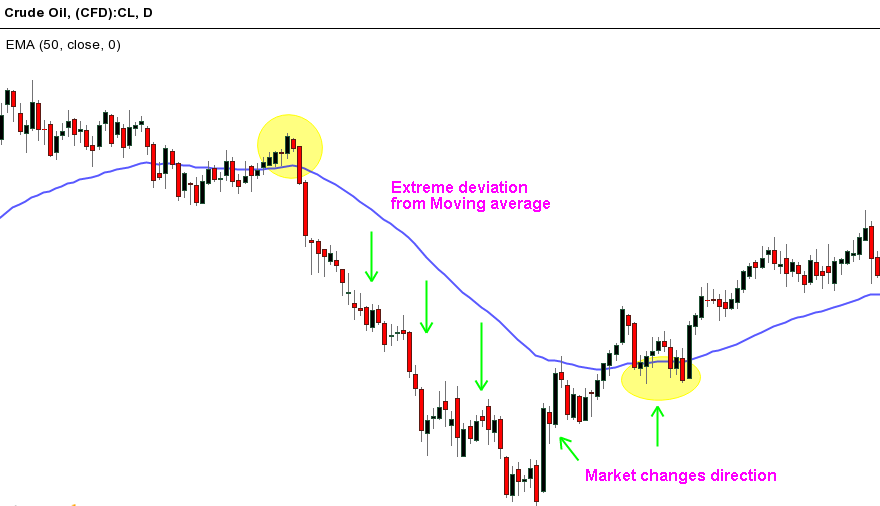
The moving average is an indicator of price extreme. Because the moving average is a mean, any reversion to the mean will tend to approach the moving average. For trading purposes, this reversion is sometimes profitable when the current price has deviated substantially from that mean or moving average. Price has a tendency to return to the mean. Thus, a deviation from the moving average is a measure of how much prices have risen or fallen ahead of their usual central tendency, and being likely to return to that mean, this deviation then becomes an opportunity to trade against the trend. As always, trading against the trend is dangerous and requires close stops, but the reversion also provides an opportunity to position with the trend when it occurs. When price action continues to move away from the Moving average in a climatic way, they are often signaling that the trend is changing direction. Have a look at crude oil chart below.
Read about climax movements in price action | Click here…
A moving average is a constant period average, usually of prices, that is calculated for each successive chart period interval. The result, when plotted on a price chart, shows a smooth line representing the successive, average prices. Moving averages reduces the effects of short-term oscillations. Many successful Price action traders use moving averages to determine when trends are changing direction. Moving averages are especially useful if applied in a proper way along with price action trading.

1 thought on “How Price Action Traders Use Moving Averages ?”
Want to learn