

Silver is now trading in important Market structure which has potential implication for future movements. Current price value of silver is 15.45$ per ounce. I have applied Price action analysis on weekly time frame chart to see the big picture of present conditions. On the Daily chart, Silver has edged higher but met with stiff resistance level at 16.00. Also watch out for Akshaya Trithiya, an auspicious festival which has the tendency to influence gold and silver prices for shorter periods.
Below is the price chart of Silver Spot Market on weekly time frame…
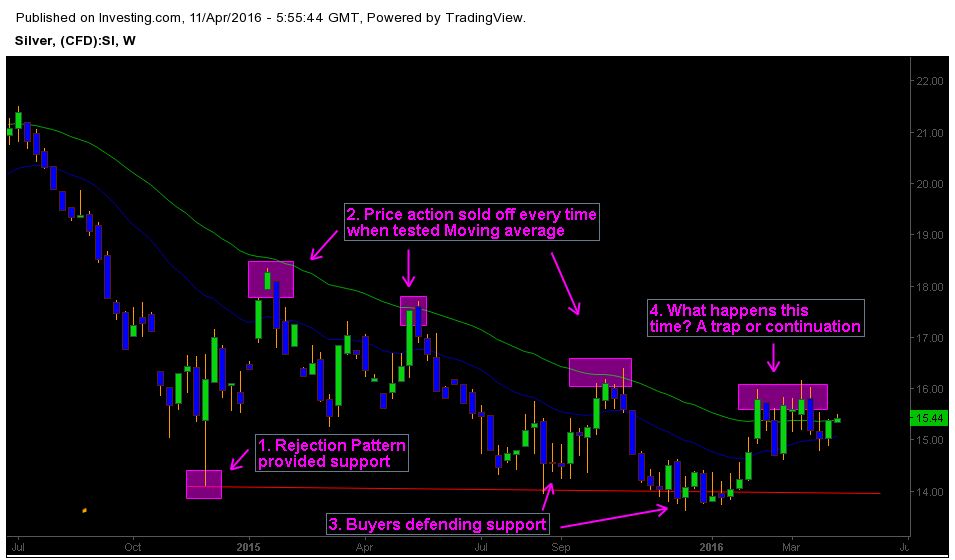
1. Rejection Pattern provided support at 14.00
Price action support and resistance are much different from traditional support and resistance levels. One important aspect is – Price action support and resistance are created by real-time market pressures opposed to historical price levels. Silver took support at 14.00 with a Rejection Pattern during the period of January 2016. As we can notice, Later Price action formed clear zone at this level with multiple tests.
2. Moving average acting as dynamic resistance
Price action sold off every time when attempted to break the 25 and 50 period EMA. Strong selling pressure is visible at moving average. The indicator acted as precise resistance zone when price action sold off every time after testing it. One thing to remember is – there nothing magical in indicators, it works if used by large number of market participants. Technical analysis in other words a “self fulfilling prophecy”. There are ways we can utilize the technical indicators by inferring to Market Sentiment a technique which I cover in trading course
3. Buyers defending the support level at 14.00
As we can see in the chart, Buyers are defending the key level after price action tested it. This indicated Buyers at support level 14.00. If selling pressure is strong enough then Silver must break the key level clearly below the resistance zone. Any buying pressure patterns such as PBF or Rejections can potentially influence the Market sentiment. So watch the strength of both buying and selling pressure.
4. Silver is testing the EMA again – What happens this time?
Previous tests ended in Major selloff, but this time there are two possibilities. 1) Price action will form a spike and trap all the weak hand players (or) 2) It continues the present market structure of dynamic resistance.
Traders should focus on price action at 50 and 25 periods EMA for potential setups and clues. Also keep an eye on the Impacts of Akshaya Trithiya.


