Tata Motor Stock Prices have seen a stellar upside even in this Volatile market condition. Stock Prices have rallied another +70% in the last few weeks. Does it still have more upside to go?
For answers, take a look at the Price Action in the weekly chart of Tata Motors. We can see a clear-cut Uptrend.
Tata Motors – Price Action Analysis on 1W Chart
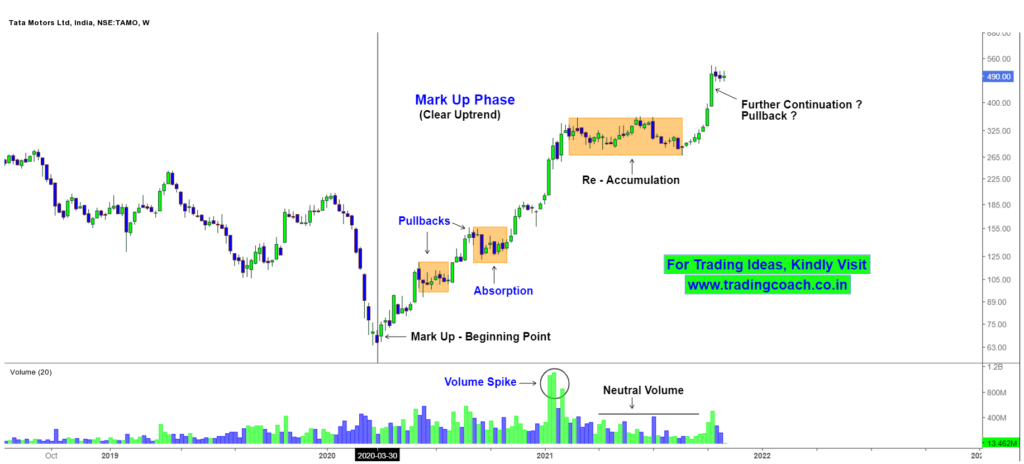
The Uptrend which we are noticing in Tata Motors is going on since the beginning of March 2020, it’s an Intermediate Uptrend. These types of Uptrend are known as Markup Phase.
So far we haven’t seen any weakness within the Uptrend. If demand continues in the Stock Prices, most likely Tata Motors will touch 600. On the other hand, if we see any negative surprises or persistent selling pressure, it may lead to Trend Reversal.
Notice how the Volume turned into neutral during the re-accumulation process; is it an Indication of Big Players silently accumulating the stock without moving the Prices too much? Well probably that’s the case.
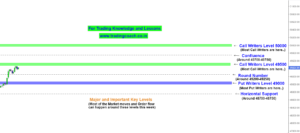
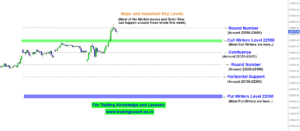
As per the long-term Price Action on 1M Chart, the next solid resistance for Tata Motors is at 600.
In my way, I won’t rush into any trading positions. I would better wait for some good pullbacks or retracements to take trades. Even if I miss some moves, I am absolutely fine with it. My focus will be to cut the risk; hence it’s better to buy at pullbacks or retracements.
Traders should keep an eye on the Price Action and must take trades accordingly.