

Since from Mid-January, Tata Motor Share prices are falling down. When we look at the higher time frame charts, we can notice an overall Structural Downtrend in the Stock. The interesting thing is – From last couple of days, Price Action is indicating exhaustion in Stock Prices. Such exhaustion could unfold into a range or opposite trend. Take a look at this Analysis on 5h chart of Tata Motors
Tata Motors Price Action Analysis in 5h Chart
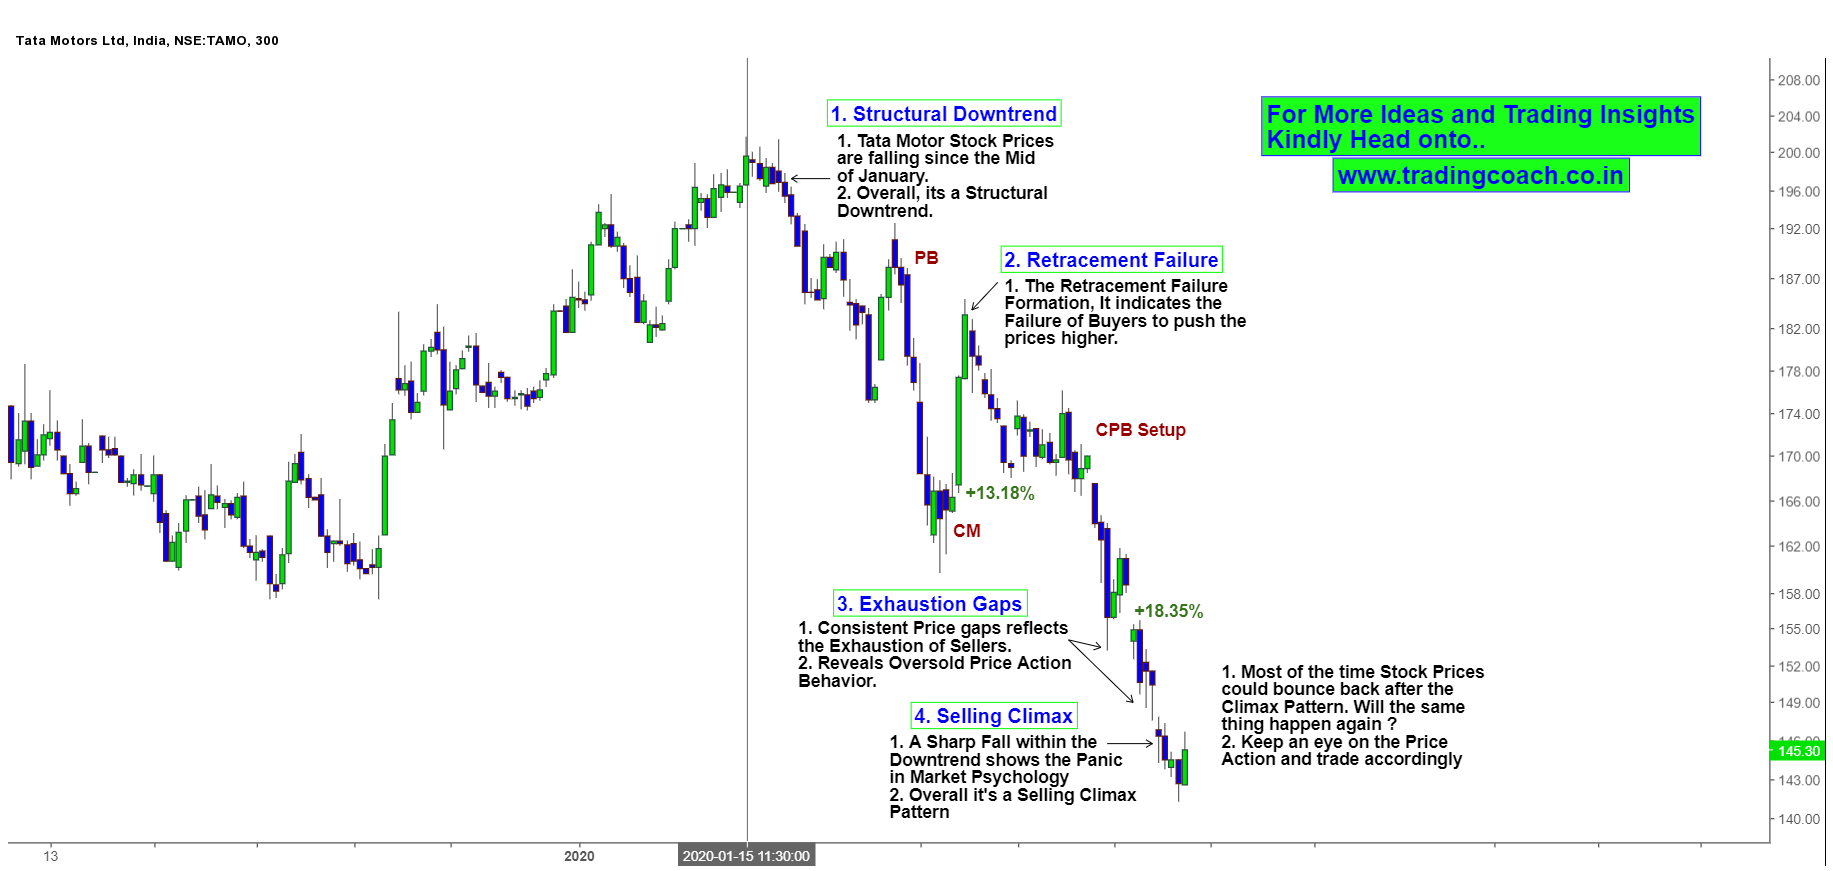
From the Beginning of February, Selloff in the Stock Prices intensified. We can notice multiple price gaps which show exhaustion of Sellers. Take a look at Point no 3. Such types of Gaps are known as Runaway gaps. These Runaway gaps could lead to a shift in Market Sentiment, at least over a shorter time period.
Apart from that, we can also notice a Selling Climax Pattern – see the Point no 4. I have already written extensively about Climax Patterns in previous articles. In a simple sense, it shows the Panic behavior of market participants who’re aggressively selling the shares at lower price. Most of the time Stock prices could bounce back after the Selling Climax formation. Will the same scenario happens once again?
Given that we see both Runaway gaps and Climax formation on the Stock, there’s a good possibility of Price Action unfolding into range or opposite trend. We must watch the market behavior in upcoming days and take trades accordingly in line with it.


