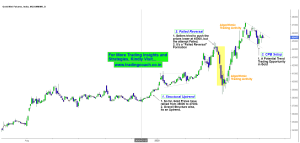
If you’re trading currency futures (USD/INR or any currencies) then you need to take this fact into consideration. It’s very important if you’re a technical trader or price action trader. Many will neglect these subtle aspects which reduces trading edge of their trading strategies into ashes. Alright many of us hate mysteries so let me get to the point. Pictures can give best introduction as always..
Interesting anomaly in USD/INR with brokers data feed
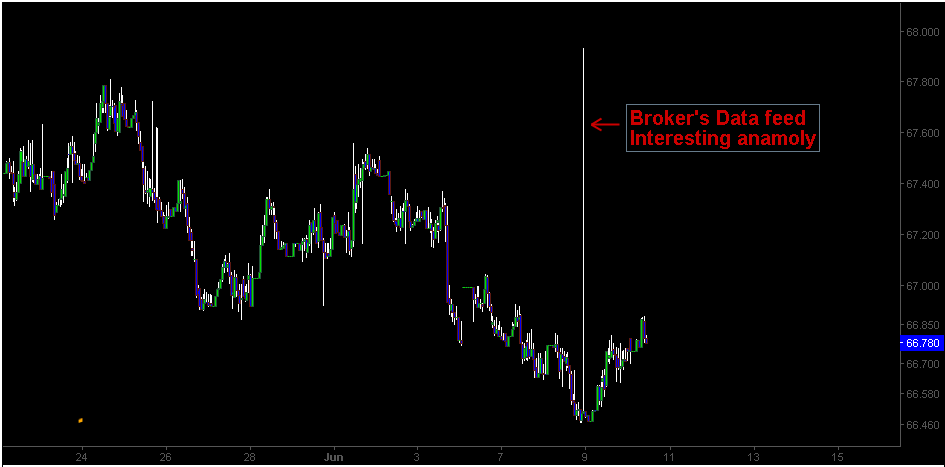
Did you see the chart above? Did you notice the price spike? Observe the shadow of candlestick on its body. Such a Kind of mumbo-Jumbo price action is indeed problematic for intraday traders. Imagine how traders could’ve digested such a price spike… How many orders might be triggered and liquidated within the movement… Feel the experience of such a price action by stepping into the footstep of an average trader.
What if I told you this anomalous price action is caused by the broker? Yes, the Natural tendency of market doesn’t behave in such a way. Though randomness plays a dominant part – it happens only to a degree. The entire process is due to broker adjusting his prices with exchange prices by balancing liquidity. In laymen terms – Broker quotes the buying and selling price which you see in the terminal. The price chart is representing broker’s price quotes and not the quote from exchange!!
Normal price action in USD/INR extracted from exchange
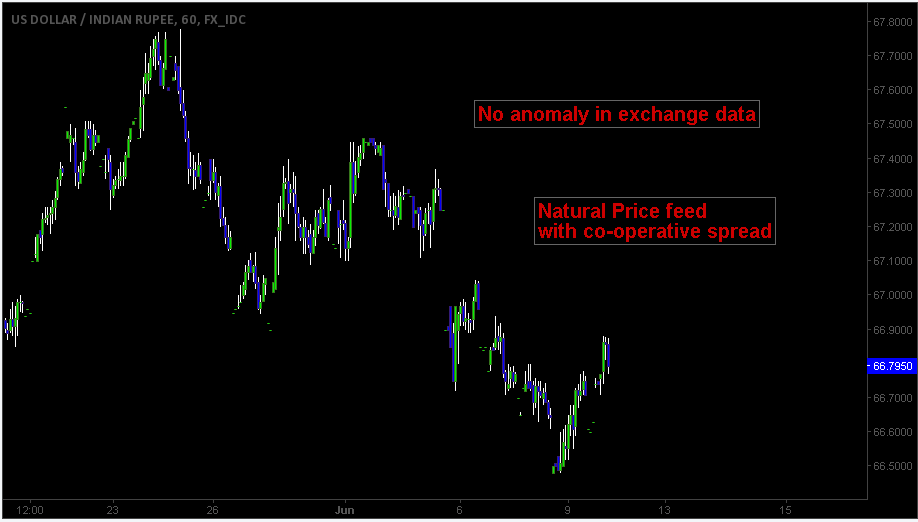
Even though there won’t be any distinction within price values such as open – close. Price action preceding the values will have significant differences. This is a big problem for technical traders or price action traders because the patterns, indicator values and technical systems are inferred from brokers price feed instead of exchange prices. For eg: You’ll be seeing the candlestick pattern of the broker prices instead of exchange prices. That means your trading edge is miscalculated.
Conclusion:
If you’re trading less liquid instruments such as USD/INR, Emerging market currencies, Third cap blue chip stocks, OTC derivatives, CFD’s etc. It’s better to avoid relying on broker’s price chart or price charts available in trading platforms. Instead, subscribe from a reliable data feed provider or refer to exchange price charts. A Chart is a statistical presentation of market action and crowd behavior, so it’s necessary that traders should see what’s really happening and not broker’s representation of what’s happening!