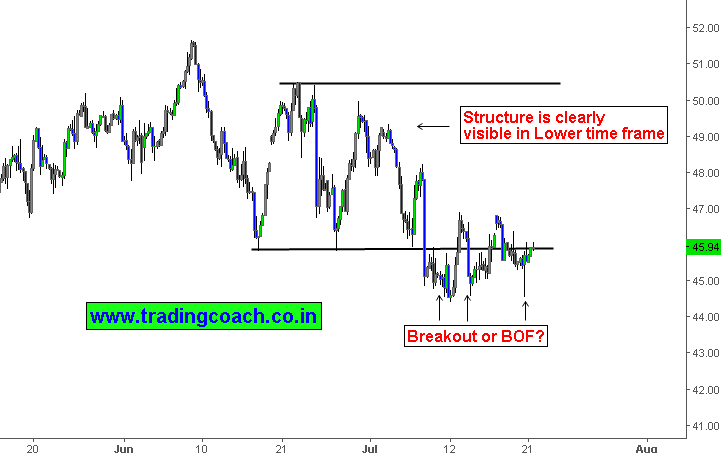
After US government reported a ninth straight week of inventory declines eased market concerns about supply glut and Oil rose 1% on Wednesday. Price action is currently trading at $46.00 per barrel, slightly higher than previous low. The rally in oil stalled after breaching $50 psychological barrier in the beginning of June. Through price action swing analysis – we can find that prices are trading in distribution phase.
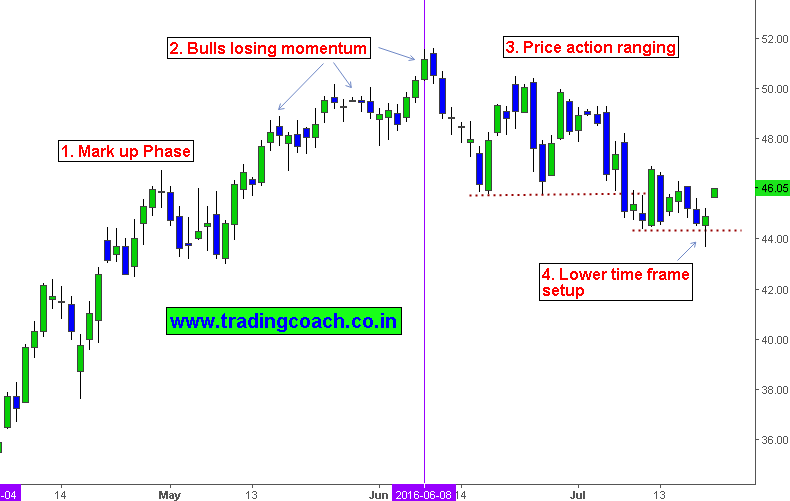
Technical analysis on Crude oil Daily chart for price action trading
1. From April till beginning of June, Price action was making higher highs composed of strong pullbacks which are technically a character of Mark up phase. To know more on market phases and market cycle read my short article about Richard Wyckoff.
2. Bulls started losing momentum after breaching $50.00 psychological barrier. Price action reflected the loss of momentum as small candlesticks and weak trend legs.
3. Following the weakness of buying pressure, Crude oil transmitted from trending to ranging market action. Structural trait of the range is distribution – As we can notice both buying and selling pressure fighting it out, but overall prices are making lower lows.
4. In the perspective of lower time frame, the current range bound structure looks much clear. Also we can spot a trading setup in lower time frame chart

While in line with expectations, Speculators are closing positions off the table. Profit taking and position adjustment factor is driving crude oil prices. There are two possible scenarios from here. Either Distribution turns into a mark down phase mimicking traditional Wyckoff cycle or Distribution fails and prices might again continue to climb again. Traders should focus on the price action in daily chart and pay close attention to Fundamentals.

