The entire market is experiencing sluggish price movements. Most of the stocks are either in correction or range.
But some defensive stocks which have a high concentration of DII investments seem to be performing well. ITC is one of those stocks.
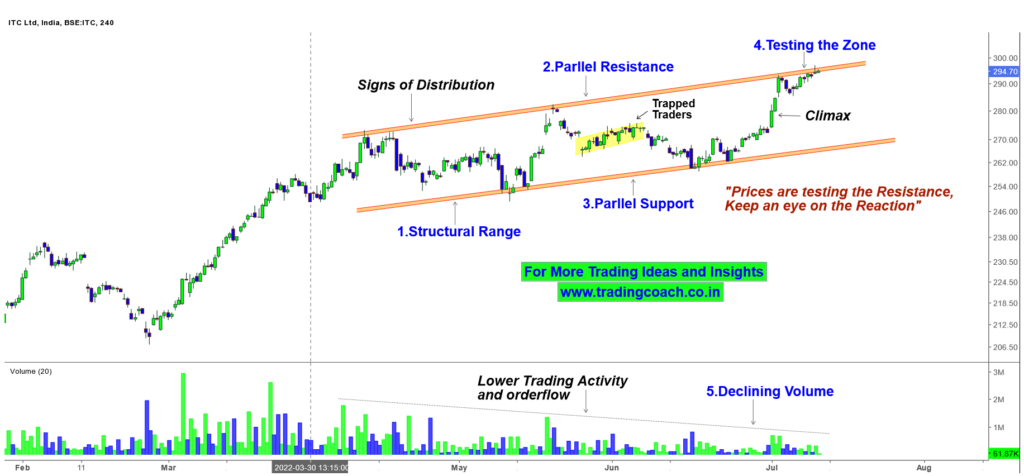
Since the beginning of March 2022, ITC stock prices have rallied all the way from 210 to 300, which is an almost 45% gain in the duration of less than 5 months. Despite the lackluster performance, prices are showing certain signs of a Distribution phase and are testing the prominent resistance zone around 295.
Take a look at the Price Action Outlook on the 4h time frame of ITC stock prices.
ITC – Price Action Analysis on 4h Timeframe

When you see the chart, it’s obvious to notice the Upward Range or Price channel in stock prices. The parallel resistance is around 294 – 300 and parallel support is around 270-275.
Buying pressure is pushing the stock prices higher, but however, we can also witness a relative weakness in the Buying pressure.
Another important point is to notice the Volume. The Volume is consistently declining, which indicates lower trading activity and decreasing order flow in stock prices.
Right now, prices are testing the resistance zone. Traders should keep an eye on the Price Action and see how the price behaviour reacts around here.
Monitor the reaction and take decisions accordingly; we might get interesting opportunities in ITC in upcoming days.
To understand more about the Price action analysis, checkout the video link given below…


