Richard Wyckoff understood that trading in Range bound markets can give excellent Risk – Reward. He went onto devise a detailed technique to analyze and trade Ranges.
Ranges that’re formed at the end of a previous trend (It could be either uptrend or downtrend) brings a balance in supply and demand of the market. In such ranges, neither buying nor selling activity will be large enough to create significant movement towards upside or downside. Hence in such type of ranges, Price action moves sideways for an extended time period. Big Institutional Players and Smart Money traders commonly referred as Composite Man by Wyckoff, take significantly large positions in these types of Ranges.
Wyckoff referred them as Accumulation and Distribution.
What is Accumulation?
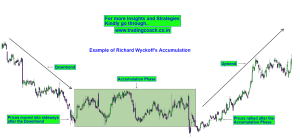
Accumulation is nothing but a sideways / Range bound market activity that happens after an extended downtrend. This is the phase where smart money traders and big institutional players try to accumulate or acquire positions without moving the prices too much to the upside.
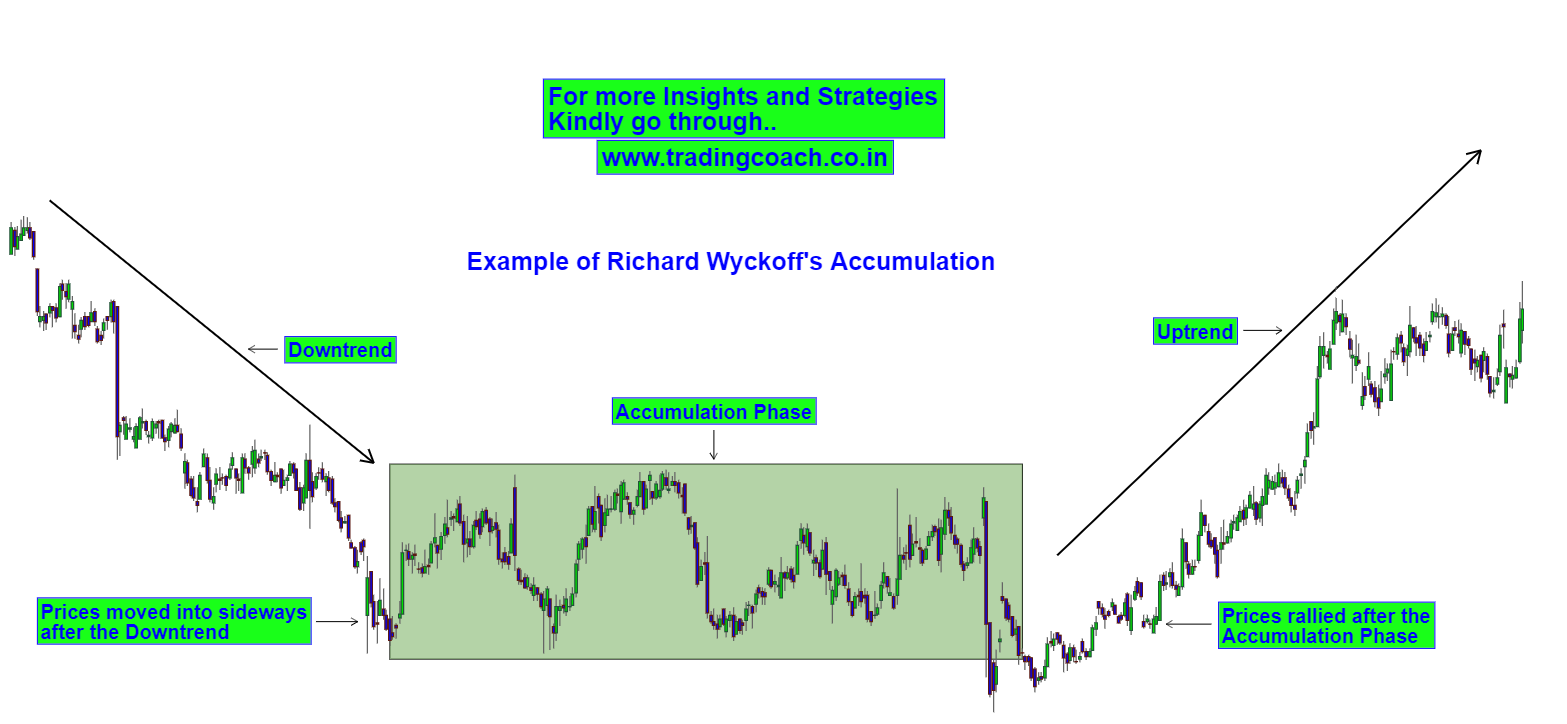
Simply Put, Accumulation means Big Players are buying the stock after a large downfall without moving the prices too much.
What is Distribution?
Distribution is the exact opposite of Accumulation. It’s a sideways/Range bound market activity that happens after an extended Uptrend. This is the phase where smart money traders and big institutional players try to distribute or sell off their positions without moving the prices too much to the downside.
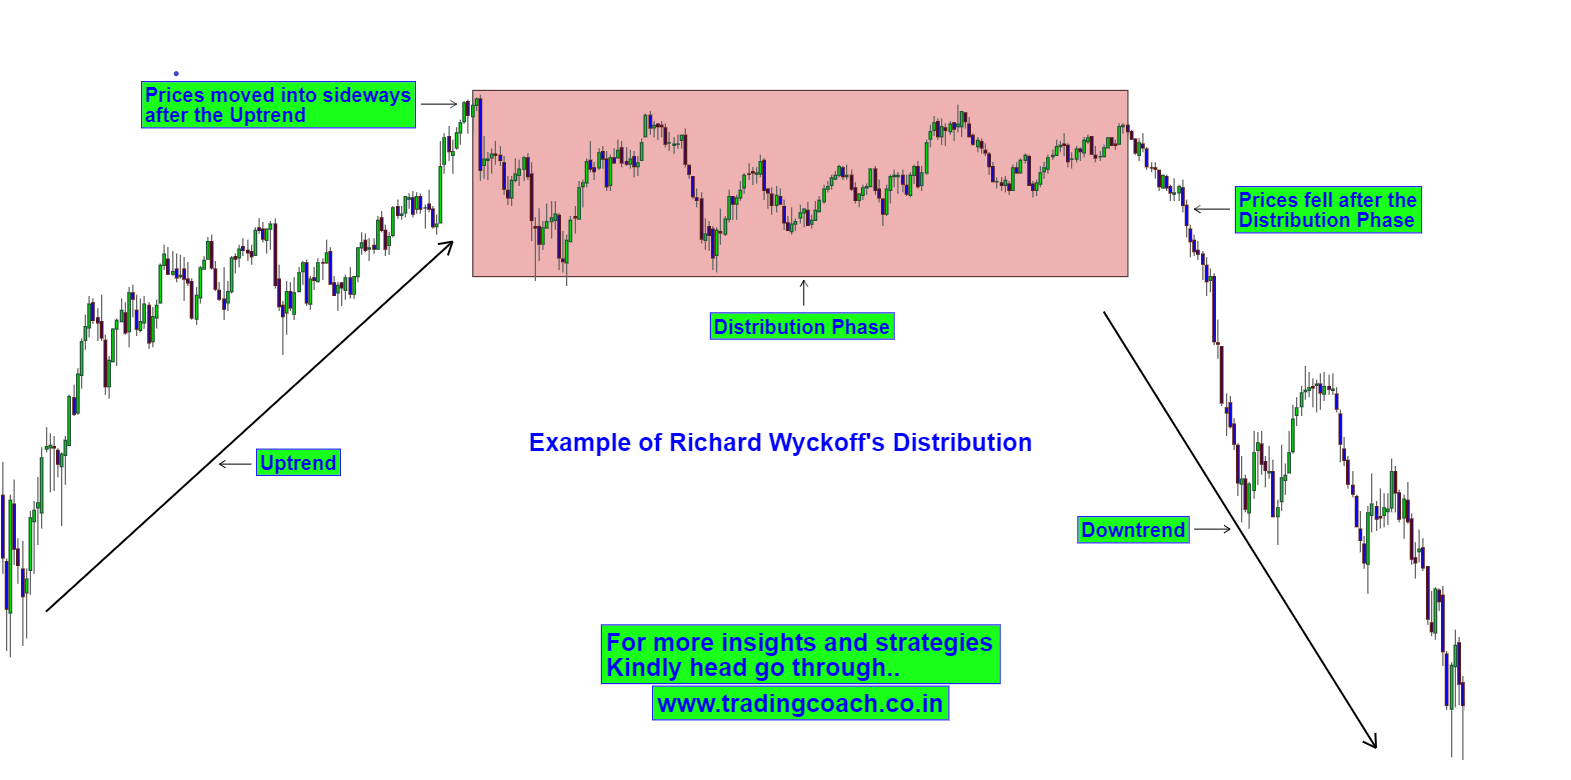
Simply Put, Distribution means Big Players are selling the stock after a large rise without moving the prices too much.
According to Wyckoff, Composite Man or Smart Money traders are buying in Accumulation Phase and selling in Distribution Phase. As a small-scale trader you should follow the footprints of Composite Man by doing the same.
Richard Wyckoff offered detailed guidelines for identifying Accumulation and Distribution phases based on certain patterns that takes place within them.
Let’s call them as “Wyckoffian patterns” – By looking at Wyckoffian Patterns you can simply differentiate between Accumulation / Distribution Phases from normal ranges.
Wyckoffian Patterns in Accumulation Phase
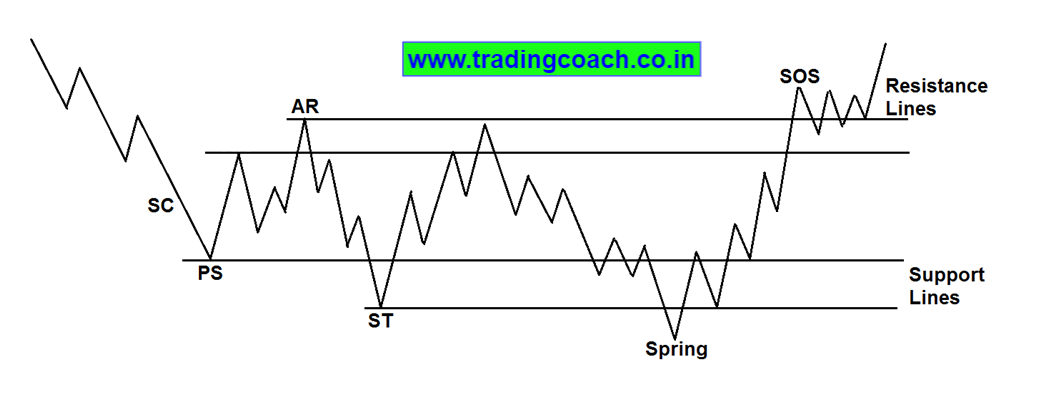
Here are the 5 Major Wyckoffian Patterns that occurs in Accumulation Phase:
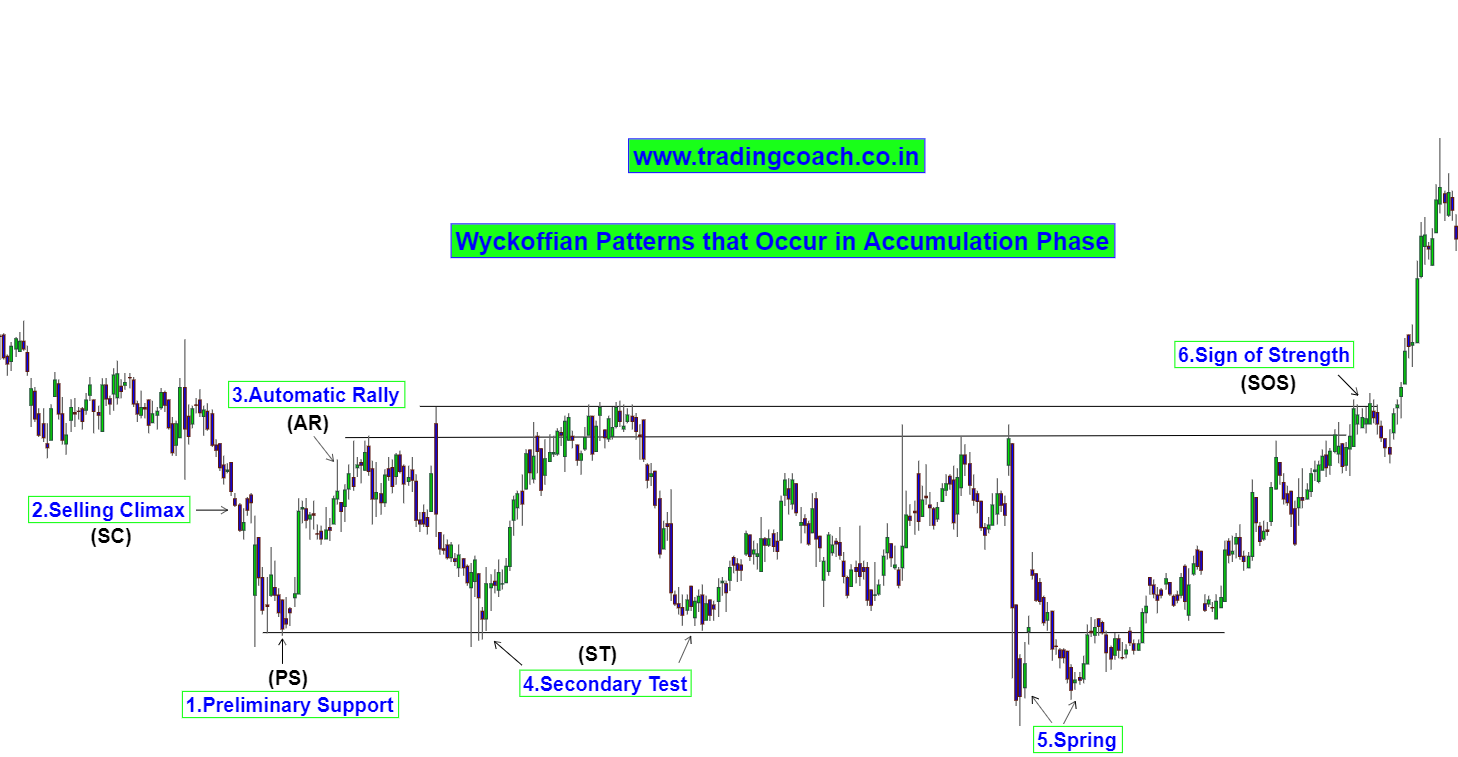
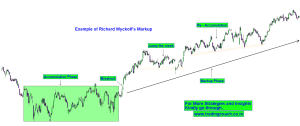
1. Preliminary Support (PS)
Preliminary Support or PS is a support level that forms after a significant fall in market prices. It’s caused by Big Institutional Players and Smart money traders, when they try to acquire bullish positions after a strong selloff. In the image, you can notice that after a Sharp fall, the price action bounced back and moved sideways – That’s the example of Preliminary Support
Once a Preliminary Support is established, Market will find it very hard to break that support level because of Strong buying interest.
2. Selling Climax (SC)
Selling Climax is another pattern in Accumulation phase characterized by sharp selloff. It takes place before the Preliminary Support or PS. It indicates that selling pressure has reached a stage in which panic selling by the public will be absorbed by Big Institutional players or Smart money traders.
Selling Climax often coincides with bad news or some negative events, as it is caused by the panic selling behavior of public Investors. Big players often use the Selling Climax to acquire positions at lower price. In the Image, you can see the example of Selling Climax Pattern.
The bounce back in market prices followed by Selling climax reflects the buying interest of Big Players.
3. Automatic Rally (AR)
Automatic Rally is an up move that forms after the Selling Climax in the Accumulation phase. The underlying buying interest cause the prices to rally higher, but quickly prices will fall back after making a new high. The highest point of this rally will become the Resistance of the Accumulation range. You can see the example of Automatic Rally or AR in the Image.
After an Automatic Rally, Intense selling activity from the Public decreases and bearish sentiment becomes weaker.
4. Secondary Test (ST)
The Secondary Test formation happens after an Automatic Rally. It’s caused by the long covering process of Public Investors, which brings the price back to the area of Preliminary Support. Often prices will bounce back after touching the Preliminary Support indicating the presence of Buying Interest.
Secondary Test is a reflection that market prices have found the bottom. It is common to have Multiple Secondary Tests, as the market will retest the Preliminary Support to check the strength of Buyers. In the Image, you can see the examples of Secondary test.
5. Springs
Springs are nothing but shakeouts that happens within the Accumulation phase. The prices will fall below the Preliminary Support of the trading range only to reverse back above the trading range within a short time period. (Often referred as False Breakout)
Springs are caused by Big Players to mislead the Public and acquire more shares at lower price. It influences uninformed traders and investors to sell their shares at lower price, as they expect further fall in stock prices. You can see the example of Springs in the Image.
Spring acts like a confirmation of Accumulation Phase.
6. Sign of Strength (SOS)
The Sign of Strength takes place after the Spring Pattern, indicating a bullish sentiment in the Market.
Sign of Strength can form like a normal pullback or minor consolidation at the Resistance level of the Accumulation range. It’s a confirmation that Sellers have lost momentum and prices will continue to rise on the upside. Most of the time SOS looks like a breakout setup which is often followed by a sharp rally on the upside. Take a look at the Image to understand SOS
Wyckoffian Patterns in Distribution Phase
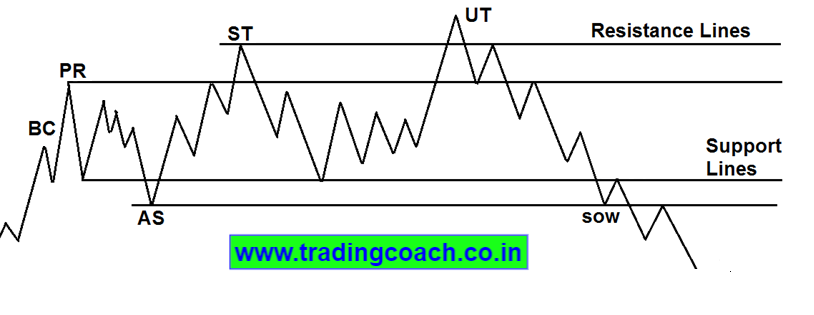
Here are the 5 Major Wyckoffian Patterns that occurs in Distribution Phase:
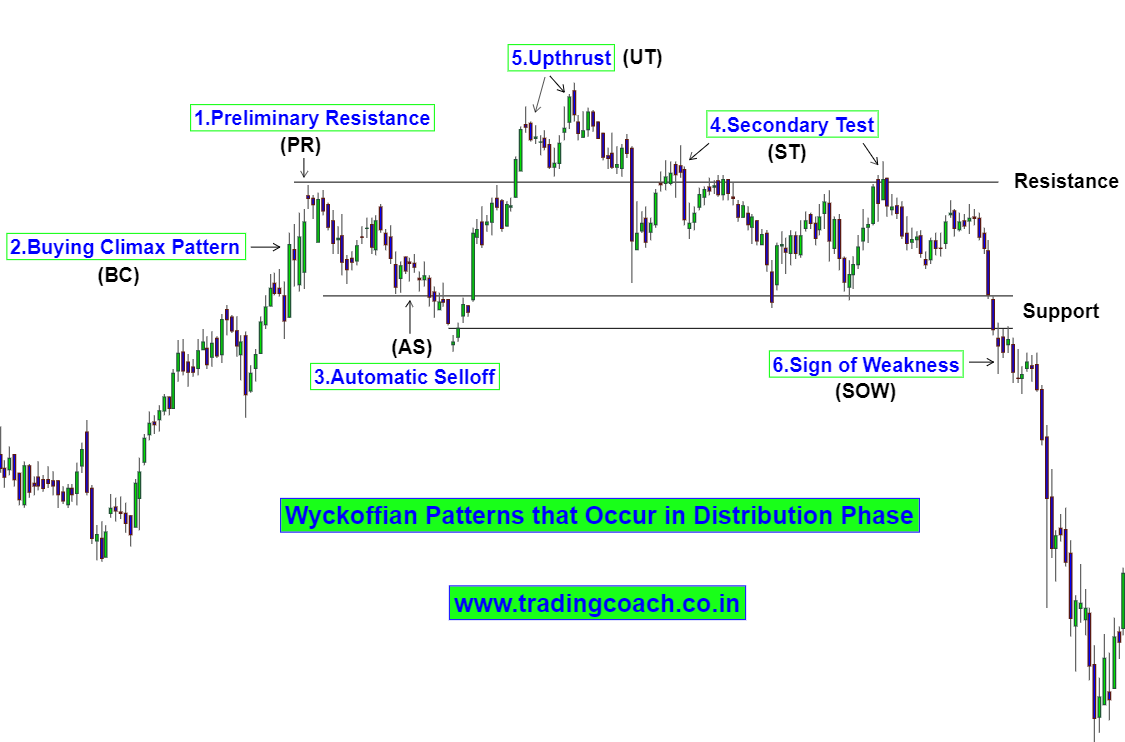
1. Preliminary Resistance (PR)
Preliminary Resistance or PR is a Resistance level that forms after a significant rise in market prices. It’s caused by Big Institutional players and Smart money traders when they try to acquire bearish positions or liquidate bullish positions after a strong rally. In the image, you can notice that after a Sharp rally, the price action fell down and moved sideways – That’s the example of Preliminary Resistance.
Once a Preliminary Resistance is established, Market will find it very hard to break the Resistance level because of Strong selling interest.
2. Buying Climax (BC)
Buying Climax is another pattern in Distribution phase characterized by sharp rally. It takes place before the Preliminary Resistance or PR. It indicates that buying pressure has reached a stage in which aggressive buying behavior by the public will be offset by Big Players.
Buying Climax often coincides with good news or some positive events as it is caused by the aggressive buying behavior of Public Investors. Big players often use the Buying Climax to offset their positions at higher price. In the Image, you can see the example of Buying Climax Pattern.
The fallback in market prices followed by Buying Climax reflects the selling interest of Big Players.
3. Automatic Selloff (AS)
Automatic Selloff is a down move that forms after the Buying Climax in the Distribution phase. The underlying selling interest cause the prices to fall lower, but quickly prices will rise back after making a new low. The highest point of this selloff will become the Support of the Distribution range. You can see the example of Automatic Selloff or AS in the Image.
After an Automatic Selloff, Intense buying activity from the public decreases and bullish sentiment becomes weaker.
4. Secondary Test (ST)
The Secondary Test formation happens after an Automatic Selloff. It’s caused by the short covering process of Public Investors, which brings the price back to the area of Preliminary Resistance. Often prices will fall back after touching the Preliminary Resistance indicating the presence of Selling Interest.
Secondary Test is a reflection that market prices have found the top. It is common to have Multiple Secondary Tests, as the market will retest the Preliminary Resistance to check the strength of Sellers. In the Image, you can see the examples of Secondary Test.
5. Upthrust (UT)
Upthrusts are nothing but shakeouts that happens within the Distribution phase. The prices will rise above the Preliminary Resistance of the trading range only to reverse back below the trading range within a short time period. (Often referred as False Breakout)
Upthrusts are caused by Big Players to mislead the public and sell more shares at higher price. It influences uninformed traders and investors to buy the shares at higher price, as they expect further rise in stock prices. You can see the example of Upthrusts in the Image.
Upthrust acts like a confirmation of Distribution Phase.
6. Sign of Weakness (SOW)
The Sign of Weakness or SOW occurs after an Upthrust pattern, indicating a bearish sentiment in the Market.
Sign of Weakness can form like a normal pullback or minor consolidation at the Support level of the Distribution range. It’s a confirmation that Buyers have lost momentum and prices will continue to fall on the downside. Most of the time SOW looks like a breakout setup which is often followed by a sharp selloff on the downside. Take a look at the Image to understand SOW
Trading Ranges like Richard Wyckoff
After performing Range Analysis and identifying Wyckoffian Patterns, one can recognize and distinguish between Accumulation and Distribution phases. As a general rule of thumb, you need to look for Bullish opportunities in Accumulation Phase and Bearish opportunities in Distribution Phase respectively.
According to Wyckoff, once you’ve identified the Accumulation and Distribution Phases you can use the Wyckoffian patterns such as SOW and SOS to take positions within them. We will talk more on that in the next content.
In Conclusion, once you can Identify Accumulation and Distribution phases, you will find excellent trading opportunities. Even though Wyckoff techniques may feel like little hard to grasp, it’s really a very simple approach to trade the markets. With a bit of practice and dedication, anyone can think and trade like Richard Wyckoff!