

Axis Bank became one of the most active stocks over last few days. Prices rallied since the beginning of August from 518.60 and current price value of Axis bank shares is 580.00. Management team has positioned itself to capture business growth from Retail, Corporate and Capital Markets. Capitalization of Axis bank has also increased often. Price action is testing the buying pressure and buyers should react positively to sustain the rally further.
Will the Short Term Trend in Axis Bank Stock Prices Continue or Shift
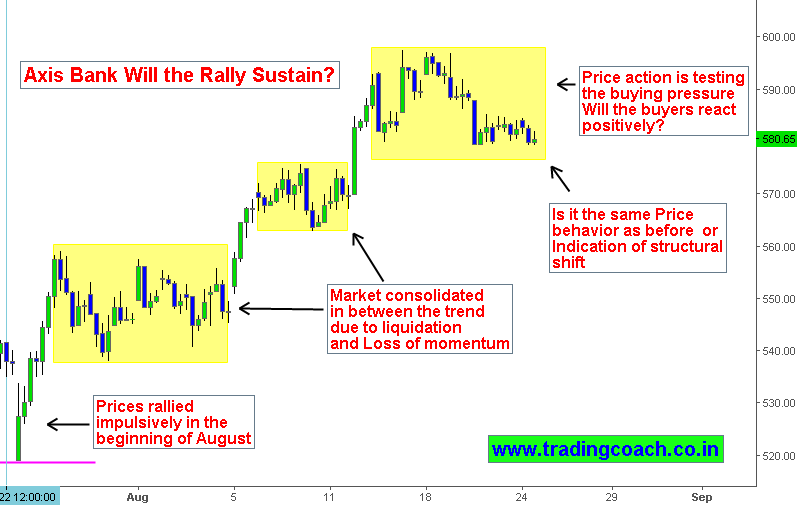
From Past three months FII have increased their holdings in Axis Bank. Better Valuation, Management and stock re-ratings have collectively triggered investor interests in share. Prices rallied impulsively in the beginning of August. Market consolidated in between the trend as management hinted towards reducing bad loans at the end of current financial year. The announcement triggered some negativity during the rally caused liquidation and loss of momentum. But the recent consolidation around 580-600 resistance is much different from earlier price behavior. It may be a sign of structural shift on short-term trend.
Price Action Ranging Near Resistance Zone
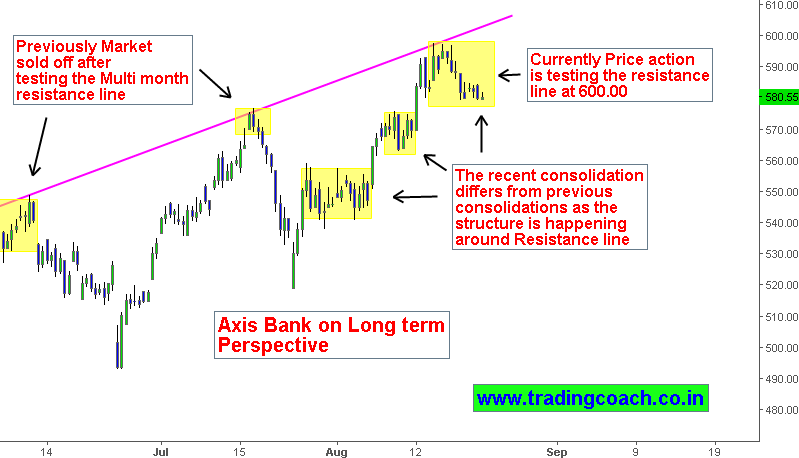
The main reason for long-term growth is due to increased weightage on MSCI Index. Axis Bank was one of the two additions to the MSCI Emerging market index in February and its weightage was later increased. Though the long-term secular trend looks positive for the stock, short-term rally indicates a structural shift. Currently price action is testing the resistance line at 580 – 600 zone intersected by multi month upper trend line. Hence the recent price consolidation differs from previous range as the structure is happening at resistance zone.
Candlestick Price Action Technical analysis on Daily chart
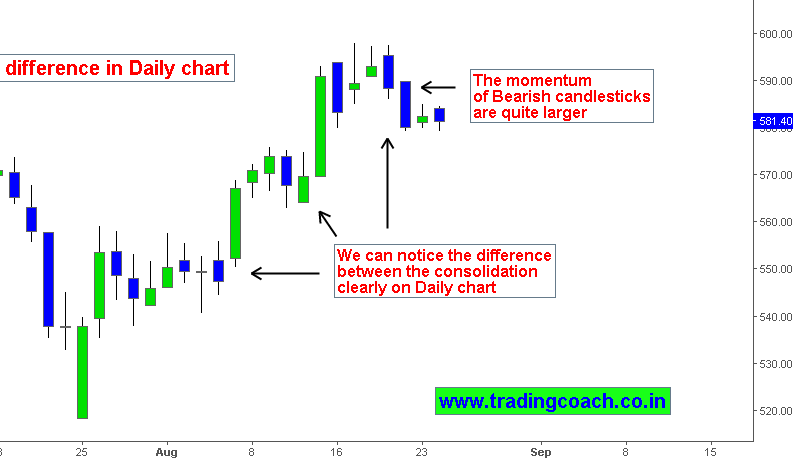
We can clearly notice the Market structure on daily chart through candlestick Price action analysis. Observe the momentum and strength behind the current consolidation and compare it with previous price action ranges on short term trend. Fundamentals are in supportive of optimistic sentiment, where technical analysis differs from the indication. Traders should observe the stock, there are possibilities to get interesting trade setups.


1 thought on “Axis Bank | What happens to Short term trend ?”
can you clear the moment of axis bank
tecanically still how much upmove remain
can we go for sort at this level
pleasae reply