Yep, Bitcoin prices are finally showing some signs of Market Bottom ! Whether it’s sustainable or not is something we need to find out. Take a Look at the Price Action Outlook on the 1D Chart
Bitcoin Price Action Trading Analysis on 1D Timeframe
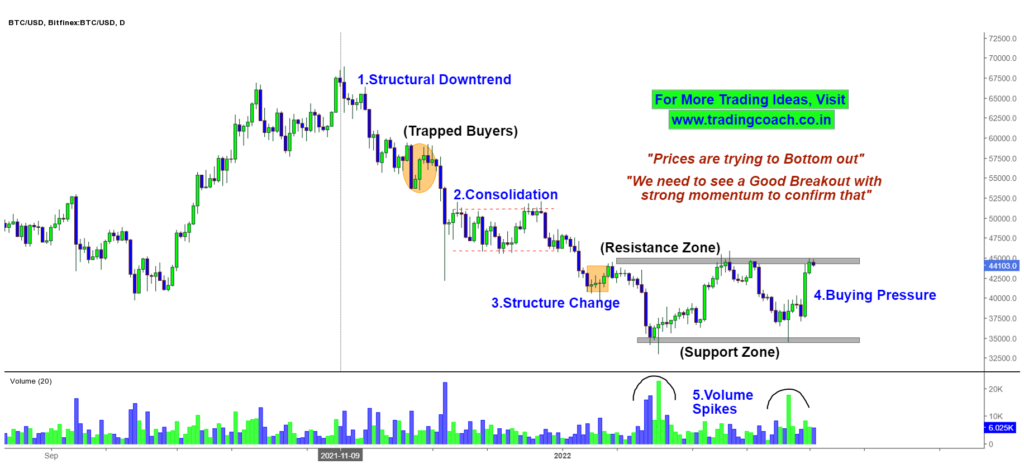
After a Persistent Downtrend from 67500, the Structure changed into a Sideways Market once it crossed 45000.
Right now, we can clearly notice the beginning stages of the Sideways Market. The Potential Resistance zone is at 45000 and the Support zone is at 35000.
The Bullish candles are a little larger in size relative to the previous Price Action. It indicates increasing Buying Pressure on the Crypto currency.
Along with that, we can also see significant Volume spikes correlating with Sideways Price Action.
Based on these Observations, it’s obvious to say that Bitcoin prices are trying to bottom out. But in order for the Bottom to sustain, we need to see a good breakout with strong momentum on the upside.
It will be interesting to watch what might happen in the upcoming days. Keep an eye on the Price Action and Market Behavior and take decisions accordingly.
Checkout the Video Lesson given below, to understand the Price Action Concept behind the Analysis…