

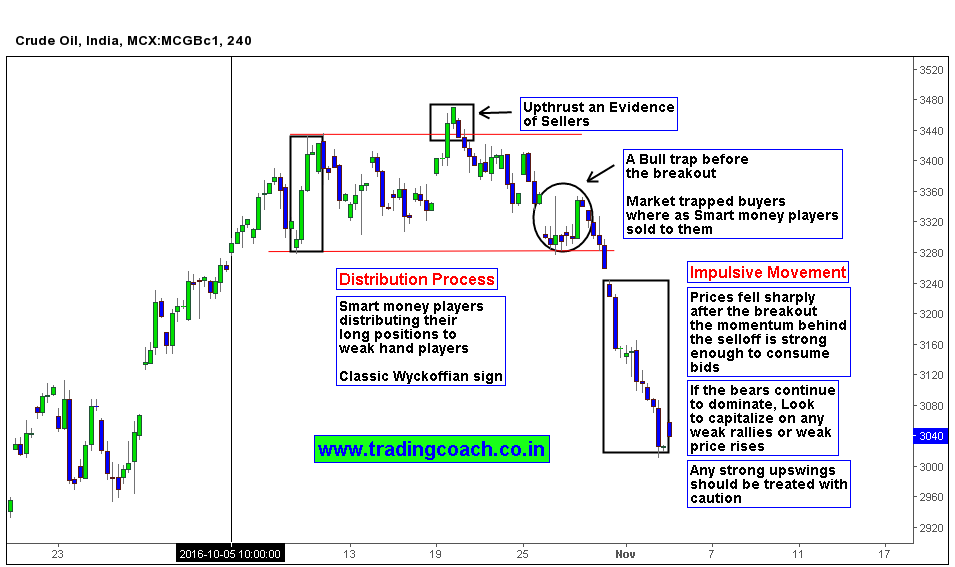
By looking at the Price action in 4h chart of MCX Crude oil (now trading at 3042.00), we can spot the bearish signs flashing through. Prices started consolidating since the beginning of October and in the start of November crude oil sold off rapidly. This is third time, Market failed to sustain above the most notable long-term resistance zone 3400.00 ($50.00 price level in Spot Market). You can see how the entire price action developed the process in my Chart analysis.
The Impulsive bearish movement in crude oil is not accidental, but an early response towards US crude oil inventory reports released on November 2 (based on IST). Oil prices extended the slump after data showed biggest out put in Crude production. Bulls holding long positions from earlier up trend either liquidated or exited their trades before and after the report. The process is clearly out lined in my chart analysis using classical Wyckoffian style. I cover these Chart Analytical techniques and Price action trading strategies in my premium trading course.
Right now bears are dominating the price action, We can look to capitalize the weakness of bulls through weak price rallies and pullbacks, as long bearish domination continues, In case of any strong upswings or price bounces (which are signs of Bullish momentum), We should reassess our trading plan and look for developing market structure.


