

Price action climbed after failing to break beneath June’s low at $46.00. The market propped after failing to breakthrough key support level. Falling dollar and technical support is the current focus for bulls. Crude has traded between $45 and 51$ a barrel over the past month and doubling from 12 year low since February. Weakening dollar increased investors appetite for commodities.
Daily chart of Crude oil for Price action trading
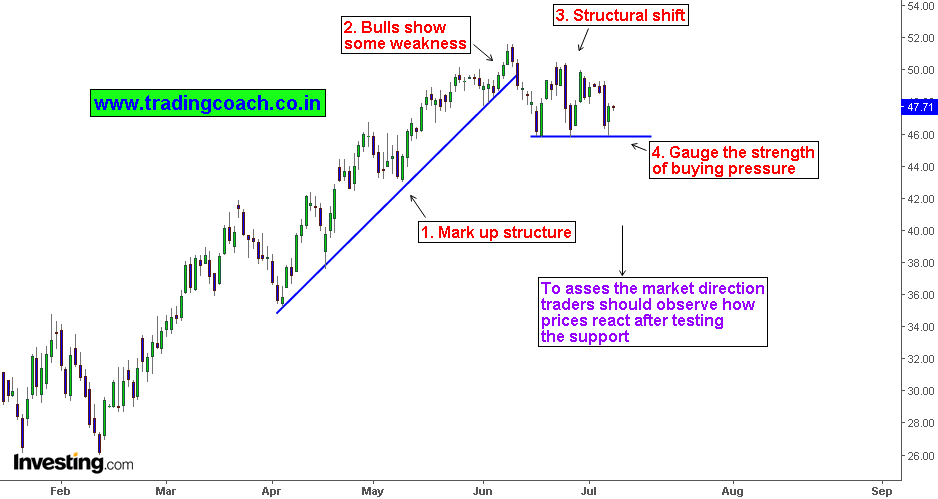
1. We can notice that price action was making higher highs from April till beginning of June. Technically from a Wyckoffian perspective, it’s a Mark Up structure.
2. Crude oil showed some seasonal weakness between May and June. Trend legs became smaller as a result though it didn’t had any selling tendencies
3. Structural shift took place around June as market transited from trend to range. The sellers are dominating within the range bound structure
4. Currently price action is testing the support level at $46.00. Futures failed to break through this June low bolstering the appeal of crude oil in time of global uncertainty. It’s obvious to notice price action influencing the market sentiment.
To asses or estimate the market direction, Traders should gauge the strength of buying pressure. In order to do this, we need to observe how price reacts after testing the support level.


