

The beauty of swing analysis lies in simplification of complex and chaotic price action. Gold is a recent example of this hypothetical claim. Between mid Jan and early Feb, Market structure in gold completed a bullish breakout pattern, especially after the retest at key level 1080.00. The price action is so subtle and chances are that most could’ve missed it. After two months of volatility compression and ranging price movements, beginning of 2016 saw a fresh influx of buy orders. Gold bugs seem rejoicing the recent developments, but nonetheless-long term market structure is still bearish and traders need more precaution trading the bullish developments in precious metal.
Know more about swing analysis here..
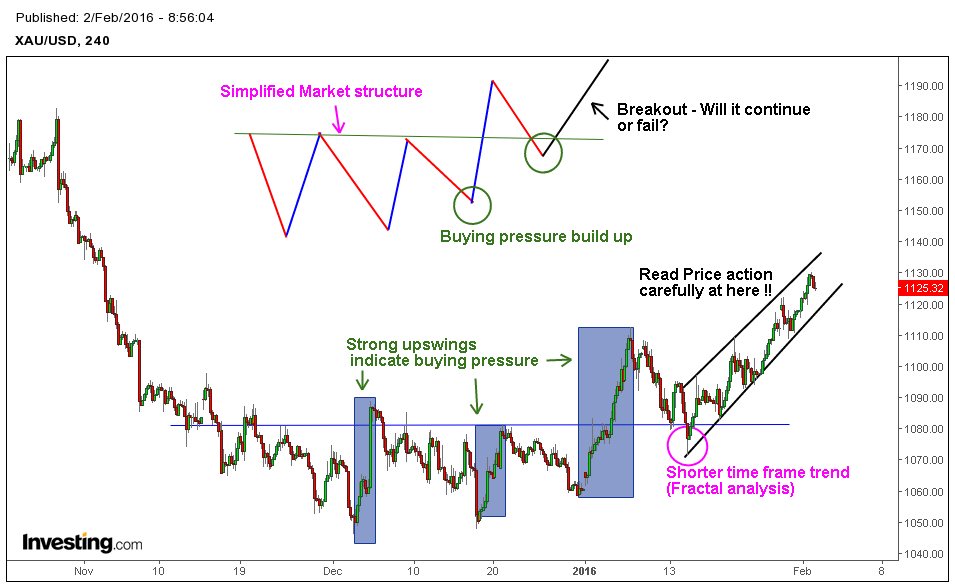
Simplified market structure offers a comprehensive view on the recent development, completion of bullish breakout pattern. Note how the previous upswings indicated the existence of buying pressure inside the range bound market. Now the focus rests squarely on the shorter time frame uptrend, formed at mid January, now trading at 1125.00. Upcoming Price action developments around this structure will offer further clues and information, so it’s necessary to read the price action carefully around shorter time frame uptrend.
Future Price action results in either one of the two scenarios:
1. If buying pressure builds momentum and continues upside, Price action will start a uptrend resulting in successful breakout confirmation. Visual indications of these results are strong upswings, successful pullbacks; support levels will hold firm and resistance will provide breakout opportunities.
2. If selling pressure reasserts or buying pressure fails, then price action reverts back to equilibrium or ranging price movements. This will be seen as another bullish breakout failure, reconfirming long-term market structural bearishness. Visual indications of these results are strong down swings, pullback failures, support levels failing and resistance holding, Momentum divergence can be seen in oscillators or momentum indicators.
Import Key levels in Gold: R – 1100.00(Trading above this), R – 1125.00, R – 1150.00, R – 1175.00 |
S – 1075.00, S – 1050.00, S – 1025.00 |


