

Recent rise in gold prices has baffled a lot of investors, multiple reasons are touted for recent gains such as FED, Safe heaven appeal etc. Gold bugs are rejoicing the move as major bottom. But before getting influenced by any of these stories, let’s see what price action tells us about yellow metal. From the perspective of daily time frame, gold is in consolidation since February 2016. Pivot high is at 1282.90 and Pivot low is at 1226.91. Gold is still in bullish market structure, but any strong falls can change the picture upside down.
Currently gold is in corrective structure, with potential resistance level at 1260.00 and potential support level at 1190.00.
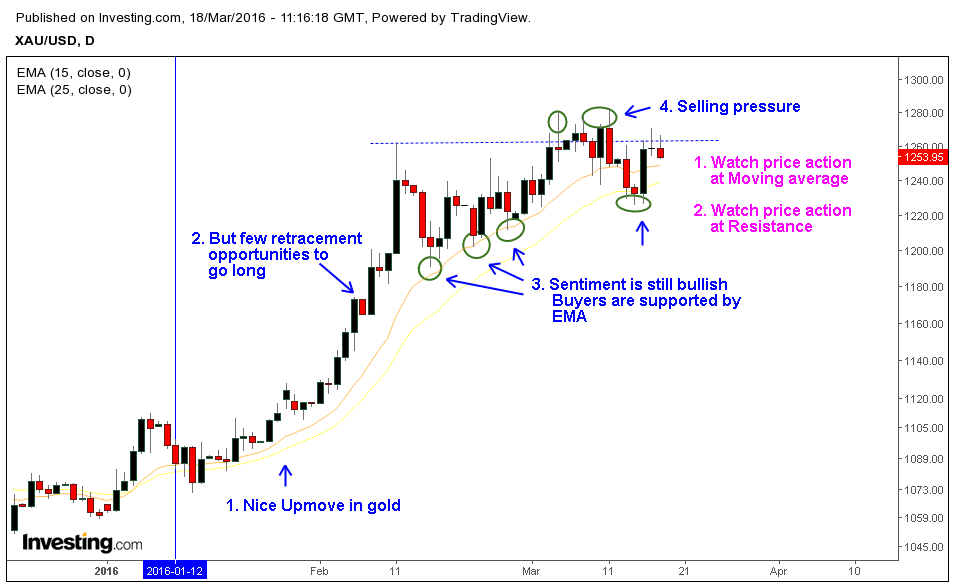
1. Price action started moving upside from beginning of Jan 2016; the rise was steady and stealthy, which influenced market participants to find various reasons including FED, Dollar, safe heaven and global crisis. One interesting aspect of gold bugs is market psychology. Normally upswings in gold are accompanied by optimistic attitude, so it’s quite natural for gold to rise sharply even in times of bear market.
2. Price action offered very few opportunities to capture the rally. It’s obvious that most retail traders could’ve missed it. When market rises sharply and steadily without any retracements or pullbacks it’s often a sign of climax than a trend. But we can’t say the same about gold, because price action after the movement didn’t indicate strong selling pressure.
3. Market sentiment is still bullish as pointed out by EMA, every earlier selloff’s were stopped at Moving average. The structure also indicates the conviction of buyers to buy the dips. Logically we can assume that market sentiment is still bullish and we need to see large selling pressure or bearish movements to change the sentiment.
4. Selling pressure is visible at resistance level 1260.00 as marked in the chart, if price action indicates more selling pressure then it may change the market sentiment – So traders should focus on Important resistance levels at 1260.00 and 1300.00 to evaluate selling pressures, also keep an eye on 25 Period EMA to check buying pressures.


