After some extended movement in previous months, most of the commodities are trading in no man’s land. Gold on the other hand is showing a different behavior, looks like range expansion move is just getting started. After 5 months of consistent Range bound activity, gold prices finally broke out from structural support zone at 1305 – 1300. One more fact is, when other base metals trended higher in previous months, Gold and Silver was almost struck within mean reversion. So the Inter market relationship between Precious metals and base metals are changing.
Price Action Analysis on Gold in Daily chart
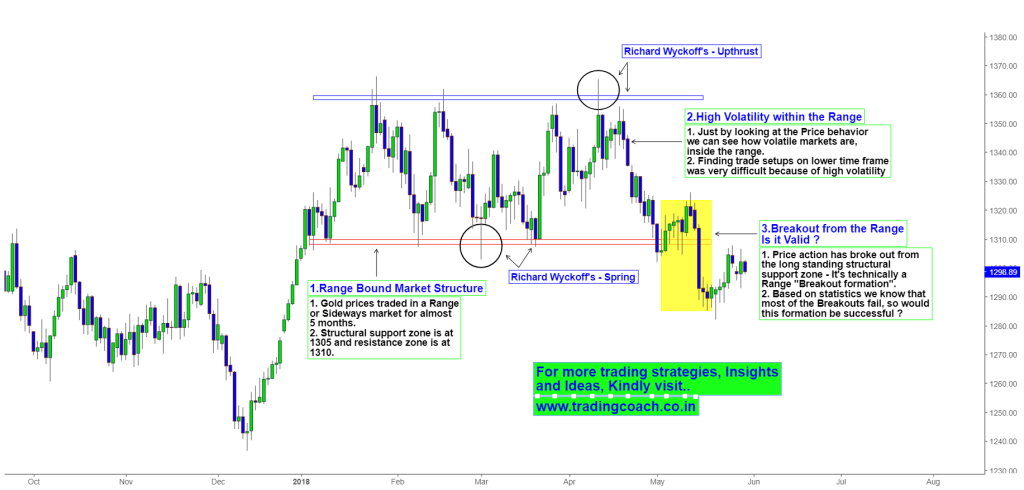
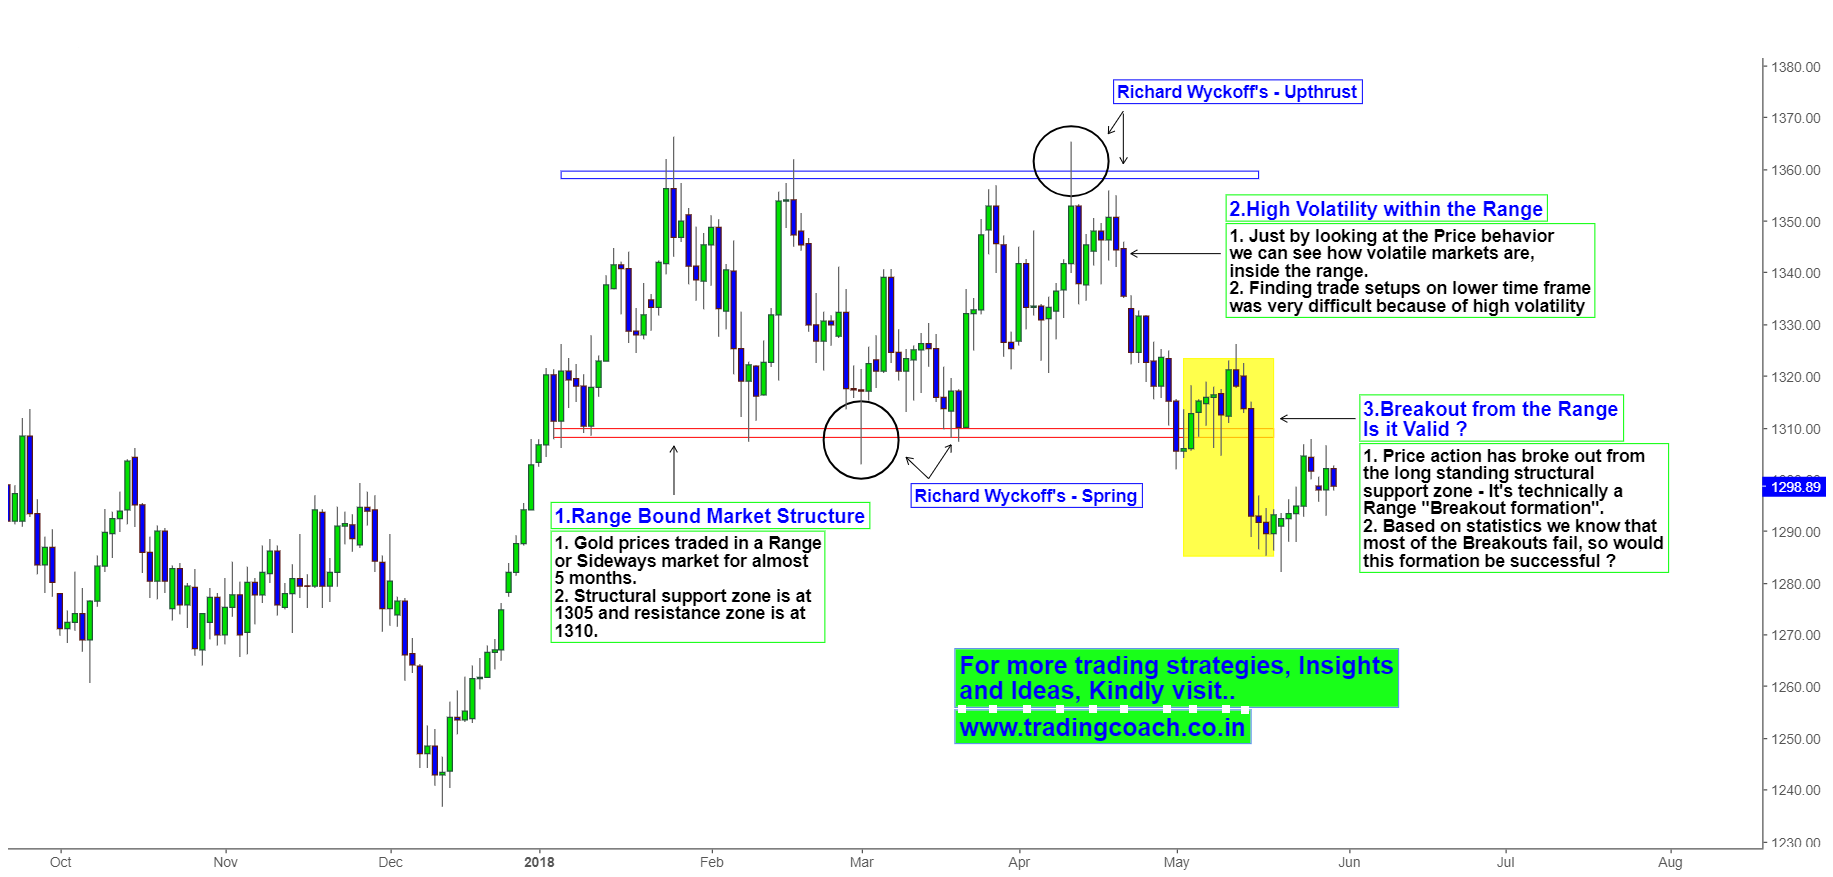
Since the beginning of 2018, Gold prices traded in a Range or Sideways market. In the process, Market action formed structural support zone at 1305 – 1300 and structural resistance zone at 1360 – 1355. We could see multiple whipsaws and false breaks around these structural zones. Even price action formed classical Wyckoff patterns such as spring and up thrust. No wonder that many small-scale traders got trapped in these fluctuations.
Initiating trades in gold was more of a challenge within this range bound market. Generally we all know that gold is a highly volatile metal, but in last couple of months that volatility was even higher and increased further with geopolitical events. As a result, finding genuine trading setups even in lower time frame was a bit hard.
In the current condition, we can see that gold prices has broken out from the long-standing structural support zone 1305, technically we can consider it as Breakout formation. Will this breakout succeed and turn into a downtrend? Or just like most of the breakouts, would this also fail? Bears are trying to expand out of the range (Range expansion), Watch the price action in coming weeks to see whether they succeed or not!

