

When we look at the Daily chart of ICICI Bank, it’s pretty obvious to witness a strong rally from 260 to 330, that started on July 16 and persisting till to date. In the vocabulary of Richard Wyckoff and Price action Traders, these type of moves are referred as buying climax (when price shoots upward), selling climax (when price shoots downwards) or simply climax movements. Why we give importance to this formation? It can cause a major shift in Market sentiment. I have written an entire article about this Pattern.
ICICI Bank Share Prices Indicate changing Market structure and Climax Movement
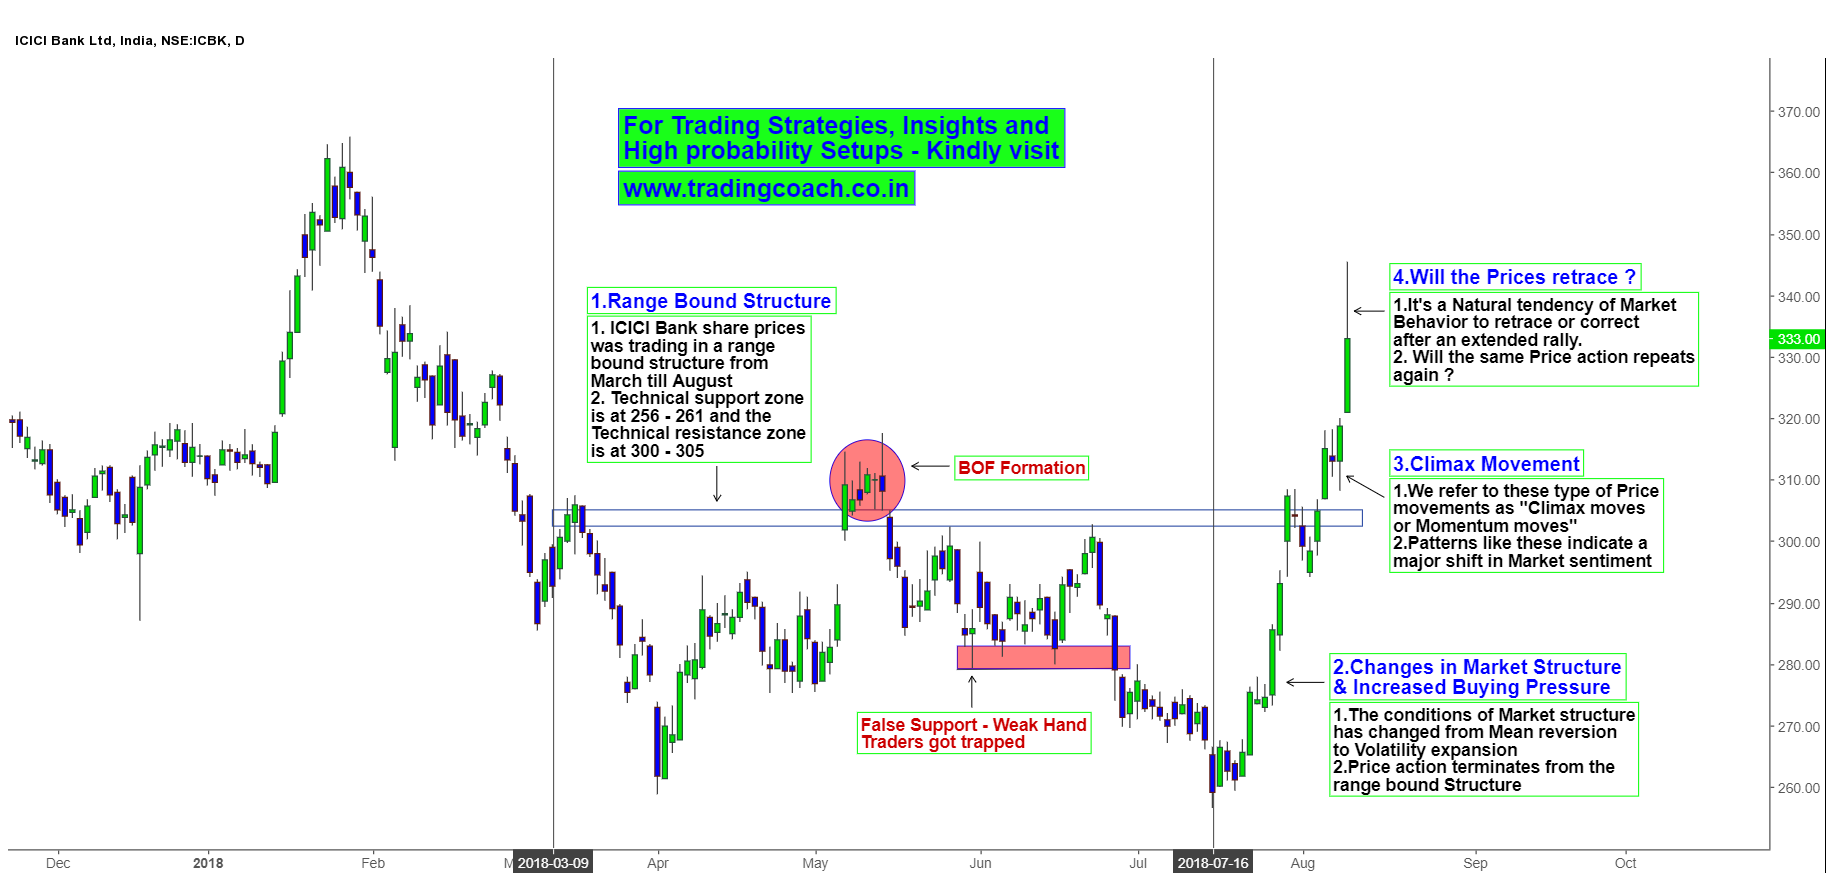
The major reason behind the rally is shifting Fundamental parameters. Investors’ optimism in ICICI bank has increased because of changing narrative from Bad loans to Growth factor. Stabilizing NPL problems and improving asset quality might influence investors to valuate ICICI Bank as a Growth stock. Another reason is when Banks emerge from NPL problems; changes in their credit quality might improve their debt ratings and share prices.
What might happen to share prices next? It’s a stiff rally without proper pullbacks or retracements. It’s also a natural tendency of market behavior to retrace after an extended rally. So there’s a high possibility of price action retracing or correcting a bit. Traders who prefer to trade stocks and stock futures can add ICICI bank to their watch list, as changing fundamentals might offer excellent Risk – reward setups in coming weeks.


