

Trading activity has increased significantly in India bulls Housing Finance, the Stock’s name constantly showed up in High Volume Category over last few days. Given the recent turn around in performance and improving Investor Sentiment, I thought of analyzing the Price Action of the Stock in Higher Time frame to get a better understanding. Here’s the Outlook of India Bulls Housing Finance on 1W timeframe.
Indiabulls Price Action Analysis of the Downtrend
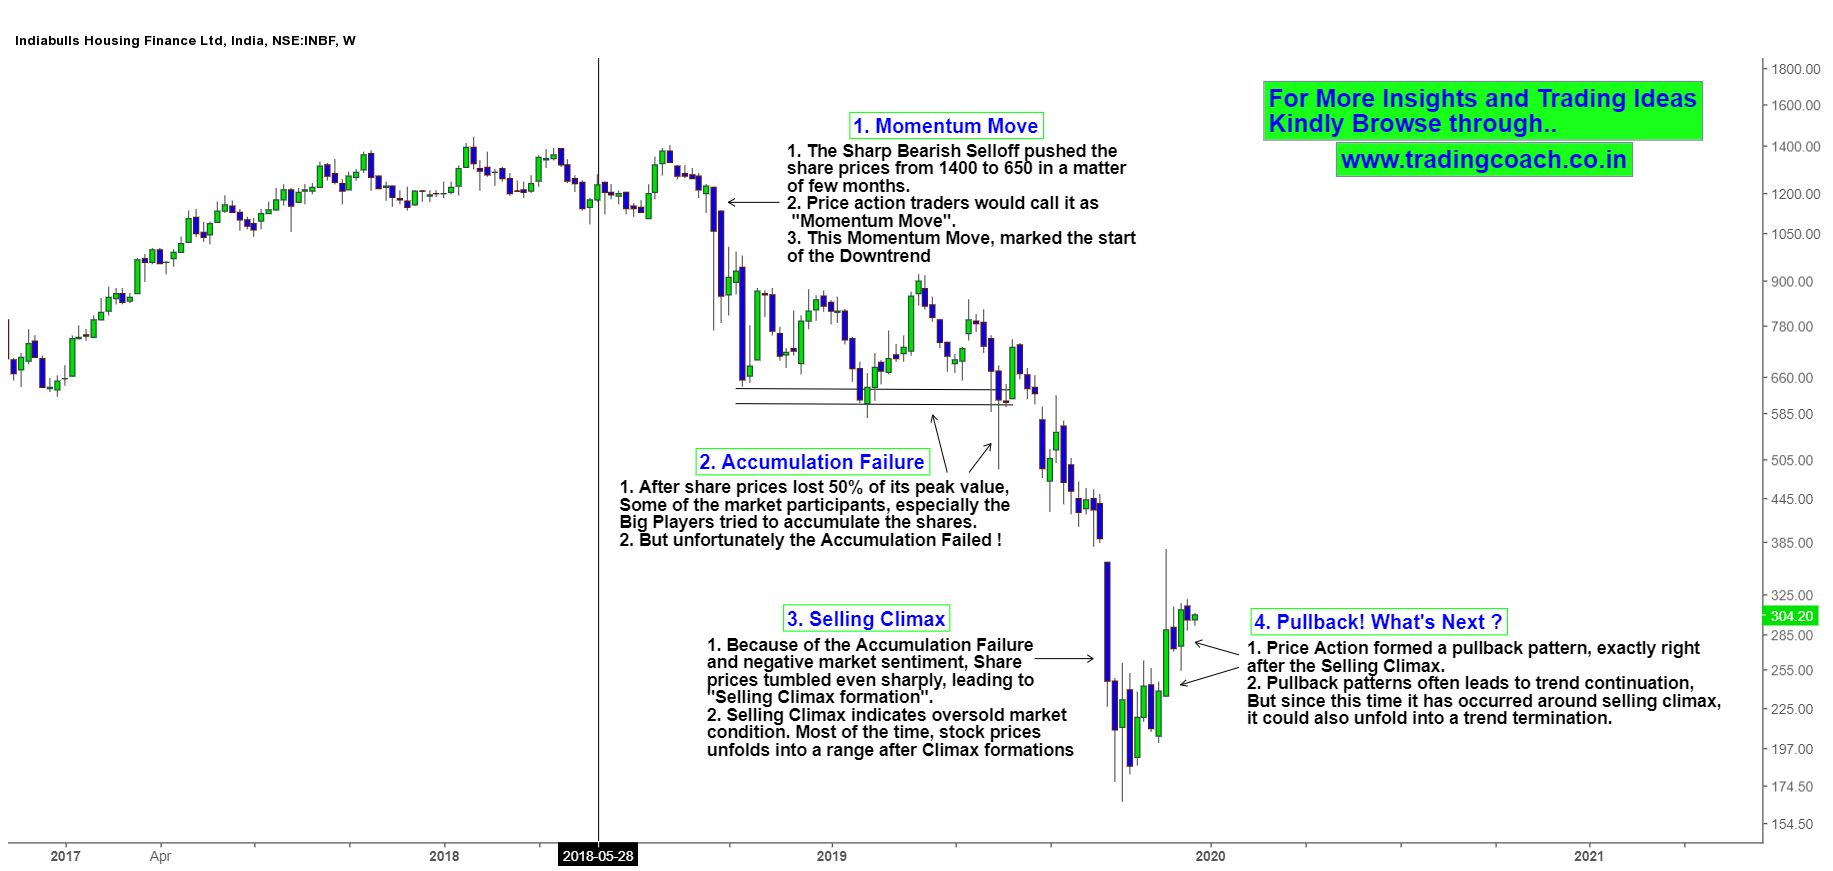
Context wise, we can see that overall Stock Price is in Downtrend. So far price has declined from 1400 to all the way down till 175, which is almost 80% wipe out in market value! Since the duration of the downtrend persisted for more than a year, it can be classified as a Long term Structural Downtrend.
Once share prices lost 50% of its peak value some big players tried to intervene and accumulate the shares on midway within the downtrend (Take a look at the chart) but unfortunately the Accumulation Failed and Stock prices continued to fall.
In the current scenario, Price action has formed a pullback pattern right after the Selling climax. Oftentimes, Stock prices will turn into a Range or reverses into an opposite trend followed by climax formations. This time it’s likely possible for market to unfold into a Range because of the current circumstances. On the other hand if Selling Pressure increases again then downtrend might continue even further. So traders should keep an eye on the developing Price Action and take decisions accordingly.


