

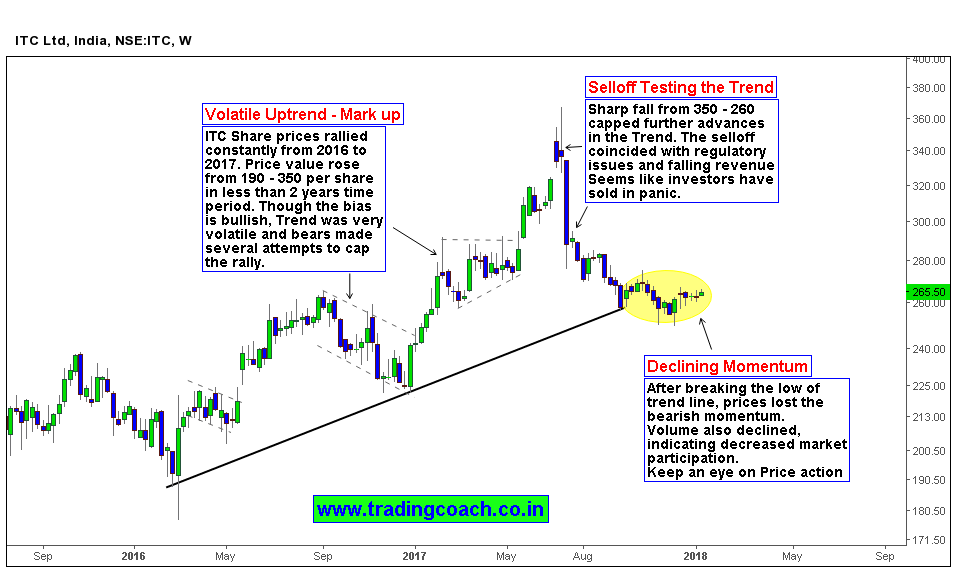
When we look at the Weekly chart of ITC Share prices its obvious to notice a Volatile intermediate uptrend. If we draw trend line by connecting the higher lows from 2016 not only we could witness the Intermediate uptrend and market prices now trading near that trend line. ITC share prices constantly rallied from 2016 – 2017. Share prices rose from 190 to 350 per share within a time period of less than 2 years. The trend was very volatile, but also offered some good setups for trend traders.
Unfavorably Market structure and sentiment changed in the month of July 2017. Sharp fall from the peak of 350 (a potential resistance zone) disrupted the trend from making further highs. In the following months market prices declined constantly till 260 (until it reached the trend line). The primary reason behind the selloff is steep hike in cess tax on Cigarettes Implemented on the month of June – July 2017. Apart from that, cigarette volume growth also took a hit because of decrease in demand, leading to decline in company revenues in the same period.
In the present context, prices are consolidating within tight boundaries after breaking the low of the trend line. We didn’t witness any selling pressure after the trend line break which technically indicates that prices lost the bearish momentum. Volume is also declining constantly from last five months reflecting that market participation is decreasing. Share prices can move sharply on either side in coming weeks as we move closer to the Budget of 2018. Focus on Price action at the Intermediate trend line, ITC can give excellent positional trading or swing trading opportunities.


