

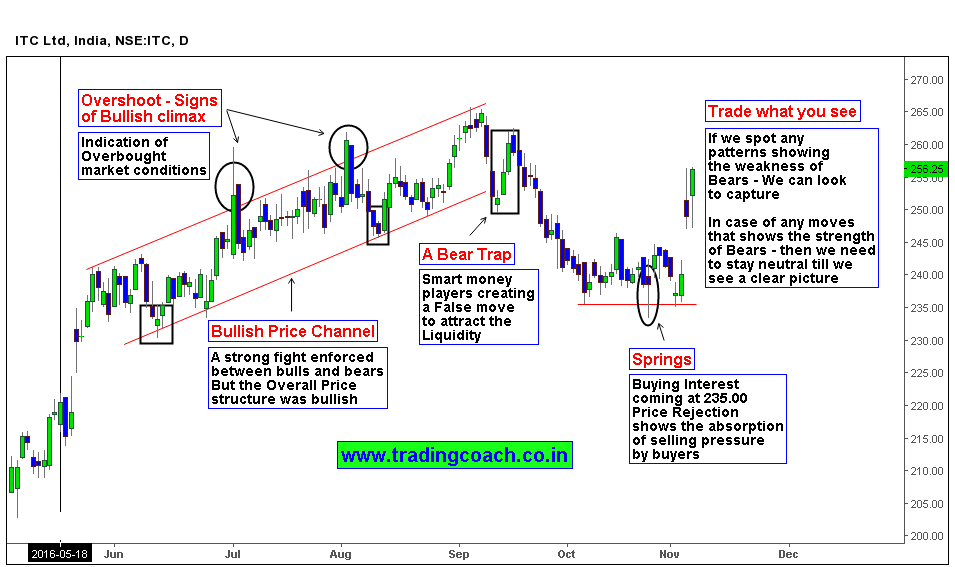
ITC was trading in bullish price channel from June 2016 till September 2016. The stock broke out of the price channel (in a bearish way) in the beginning of September 2016. (In the perspective of Daily chart) Since then stock prices became pretty random as well as challenging for traders to comprehend and analyze the Market psychology and to spot Price action trading setups. Prices were in tight consolidation between 235.00 and 245.00 throughout the month of October. I cover these kind of Chart analysis, Price action trading strategies and more in my trading course
Around the end of October, When Bears failed to push the market below 235.00 reaffirmed the buying interest of smart money players in the stock. The spring pattern on both 4h and Daily chart is reflection of this. Price rejection of the spring shows the absorption of supply by the buyers. Eventually prices bounced higher and now trading at 255.00. It’s better to buy at lower price value, as long as we see the weakness of bears sustaining. Incase of any moves that signals the bearish momentum or force (such as Sharp selloff or retracements, bullish pullback failures etc.) should be treated with caution and may result in modification of trading strategy.


