

After testing the multi month resistance zone at 1370 – 1360, (I have pointed many times in previous articles that support and resistance are zones, not levels) Gold Price action is consolidating briefly near that resistance zone since the beginning of Feb 2018. Though Prices are tumbling down, both bulls and bears are in a tug of war to determine control over the market sentiment. The picture is clearly visible on the daily chart of Gold:
Gold Price Action Analysis in Daily chart
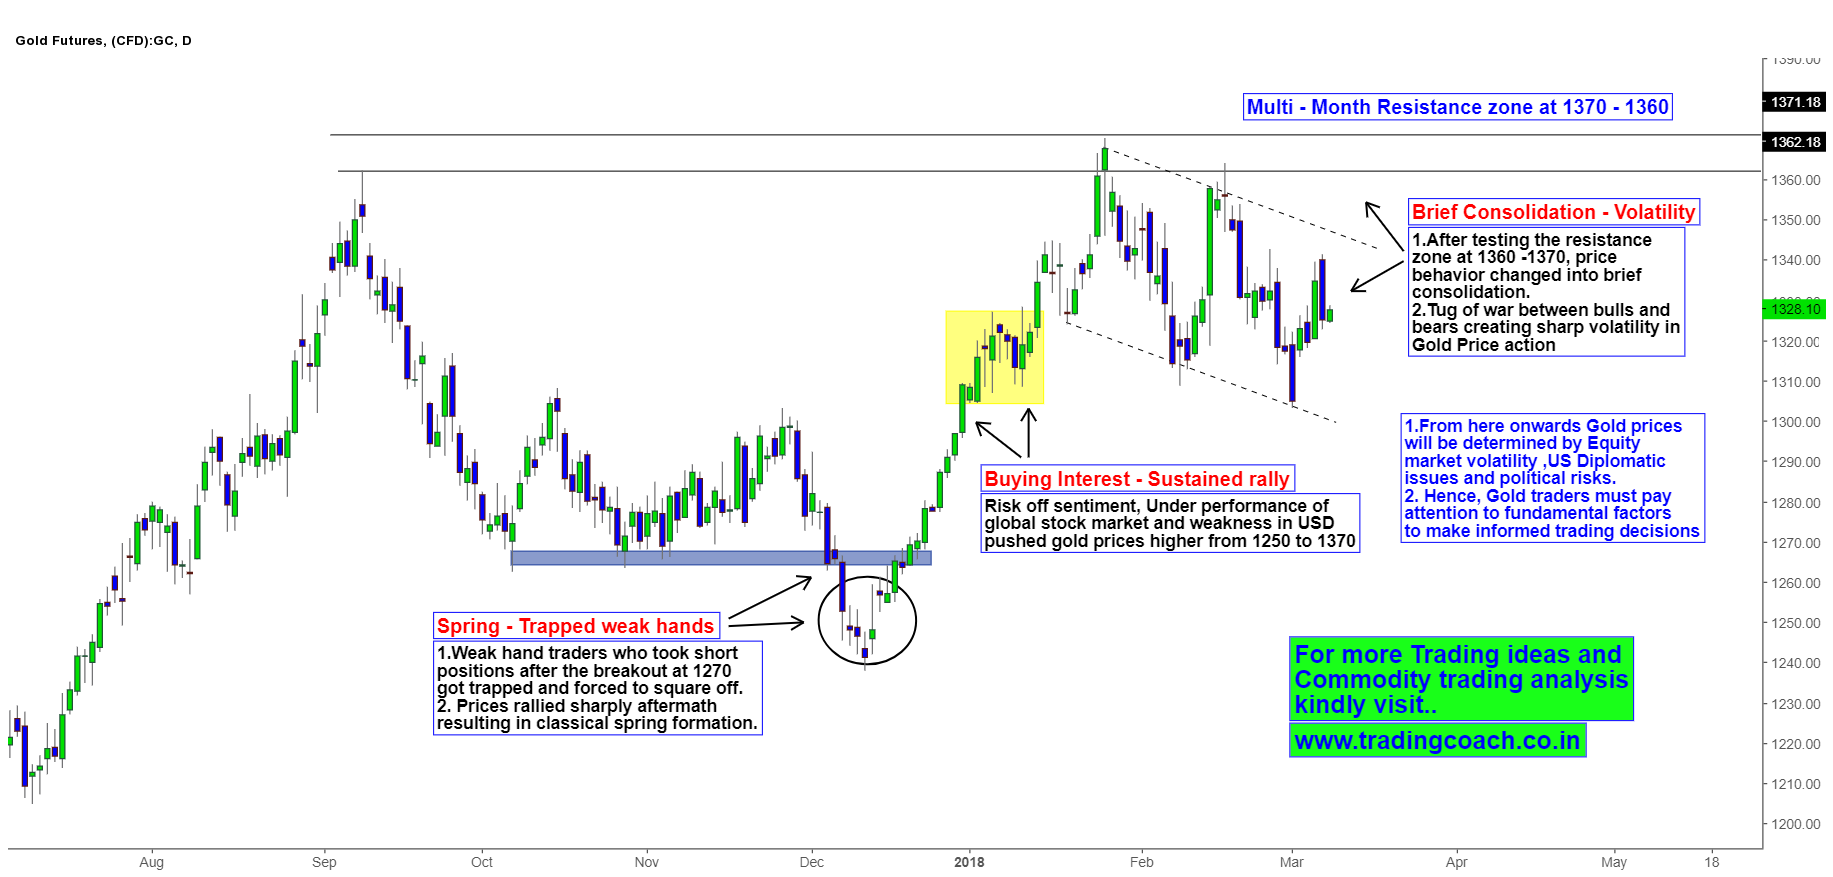
During the months of Dec – Jan, Gold prices skyrocketed from 1250 to 1370, gaining almost 35%. Gold is a “fear metal”, trend in gold prices are always driven by Global situation and Geo – political stability. Increasing economic uncertainty especially in US, Stock market volatility – selloffs are the primary reasons for extended rally in the period of Dec – Jan. Weakness in USD is another variable which helped gold prices to make further highs.
In the present context, Gold prices are consolidating below the resistance zone 1370 – 1360 after trying to break it, in the month of Feb. From here onwards, Gold prices will be determined by equity market movements, US diplomatic – political issues and global markets volatility. Gold Traders should pay attention to these fundamental factors and trade according to price action setups.


