
Price action of Natural gas is currently trading in a range bound structure between 2.795 and 2.625. Market retreated after testing two week highs with healthy supply still outweighing demand for gas-fired power. Natural gas traded most of the July on retreat, a storage glut, record high production has raised too many questions for long-term market trend and sentiment.
Different Technical structure in Natural gas on daily and weekly chart
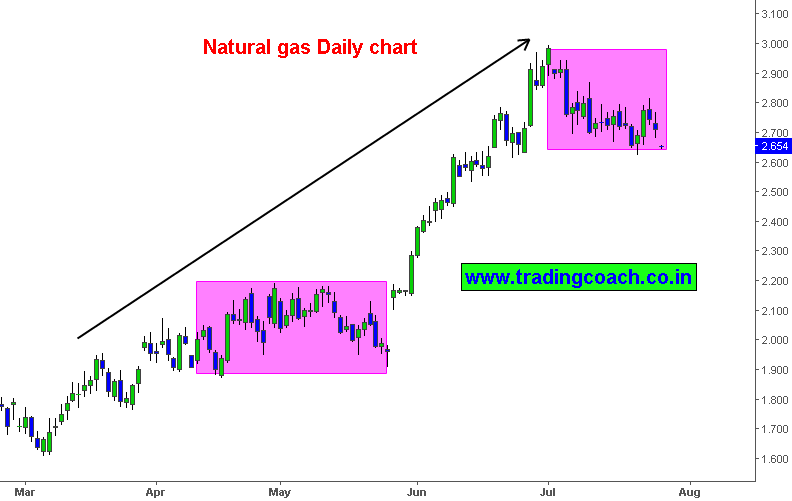
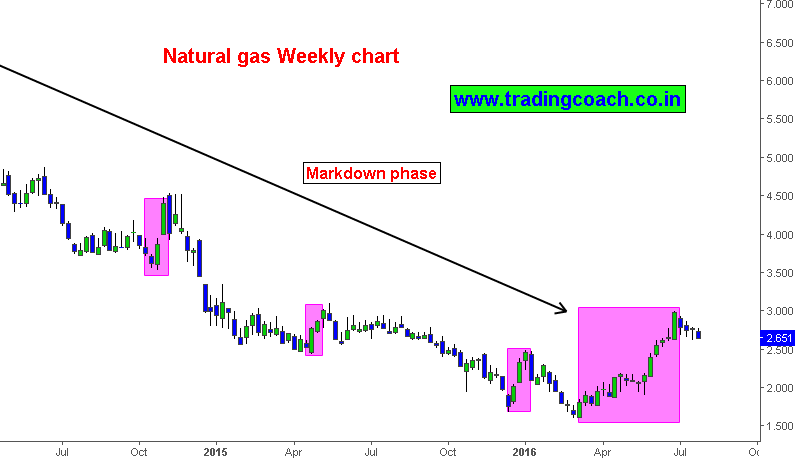
The prices in daily chart and weekly chart differ radically from each showing distinct structures in logarithmic scaling. Many traders are skeptical about recent rallies in broad energy markets. Fundamentals are diverging from price action in Natural gas created the problem of estimating true value.
Technical analysis of Natural gas in 4h chart for Price action trading
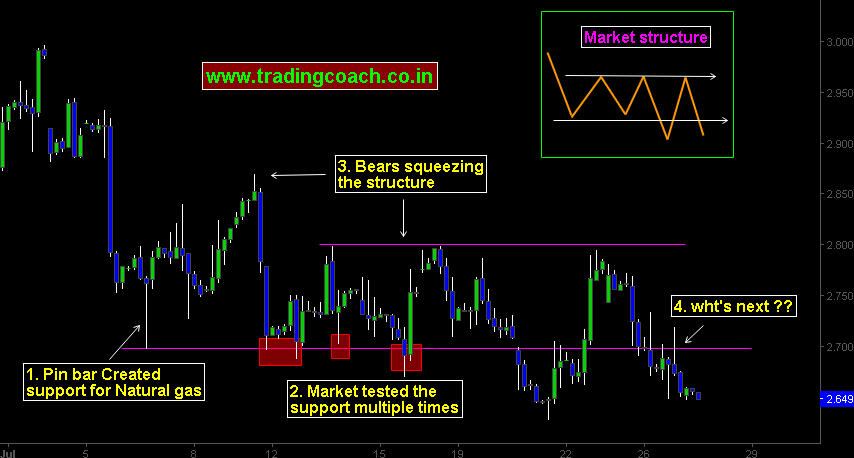
1. Price action formed a pin bar at 2.700 on July 6th. The bullish pin bar marked the support zone, market is playing a supply demand game around this zone.
2. Natural gas tested the support zone 2.700 – 2.670 multiple times. During July 21st, Price action broke the support zone but the move failed to sustain beyond 2.630 – resulting in Wyckoff spring
3. Also we can notice that bears are currently dominating the market structure, by squeezing the price levels lower. Bulls should defend the support zone in order for optimistic sentiment to continue.
4. Price action is once again testing the previous low at 2.630. Traders should observe how price behaves after the test.
In right upside corner of the chart, market structure is clearly highlighted. We need to observe how prices will behave inside the range; Traders can trade with the range or against the range by anticipating breakouts. It is essential to keep an eye on fundamental supply-demand report of natural gas.