

Lower time frame Price action of Natural gas is very random and hard to grasp, hence I decided to switch on weekly chart which gave a very good picture on the market structure. Natural gas prices are struck in a major range of 2.500 – 3.500 since from 2017. Have a look at the chart analysis given below.
Natural Gas Price Action Analysis on Weekly chart
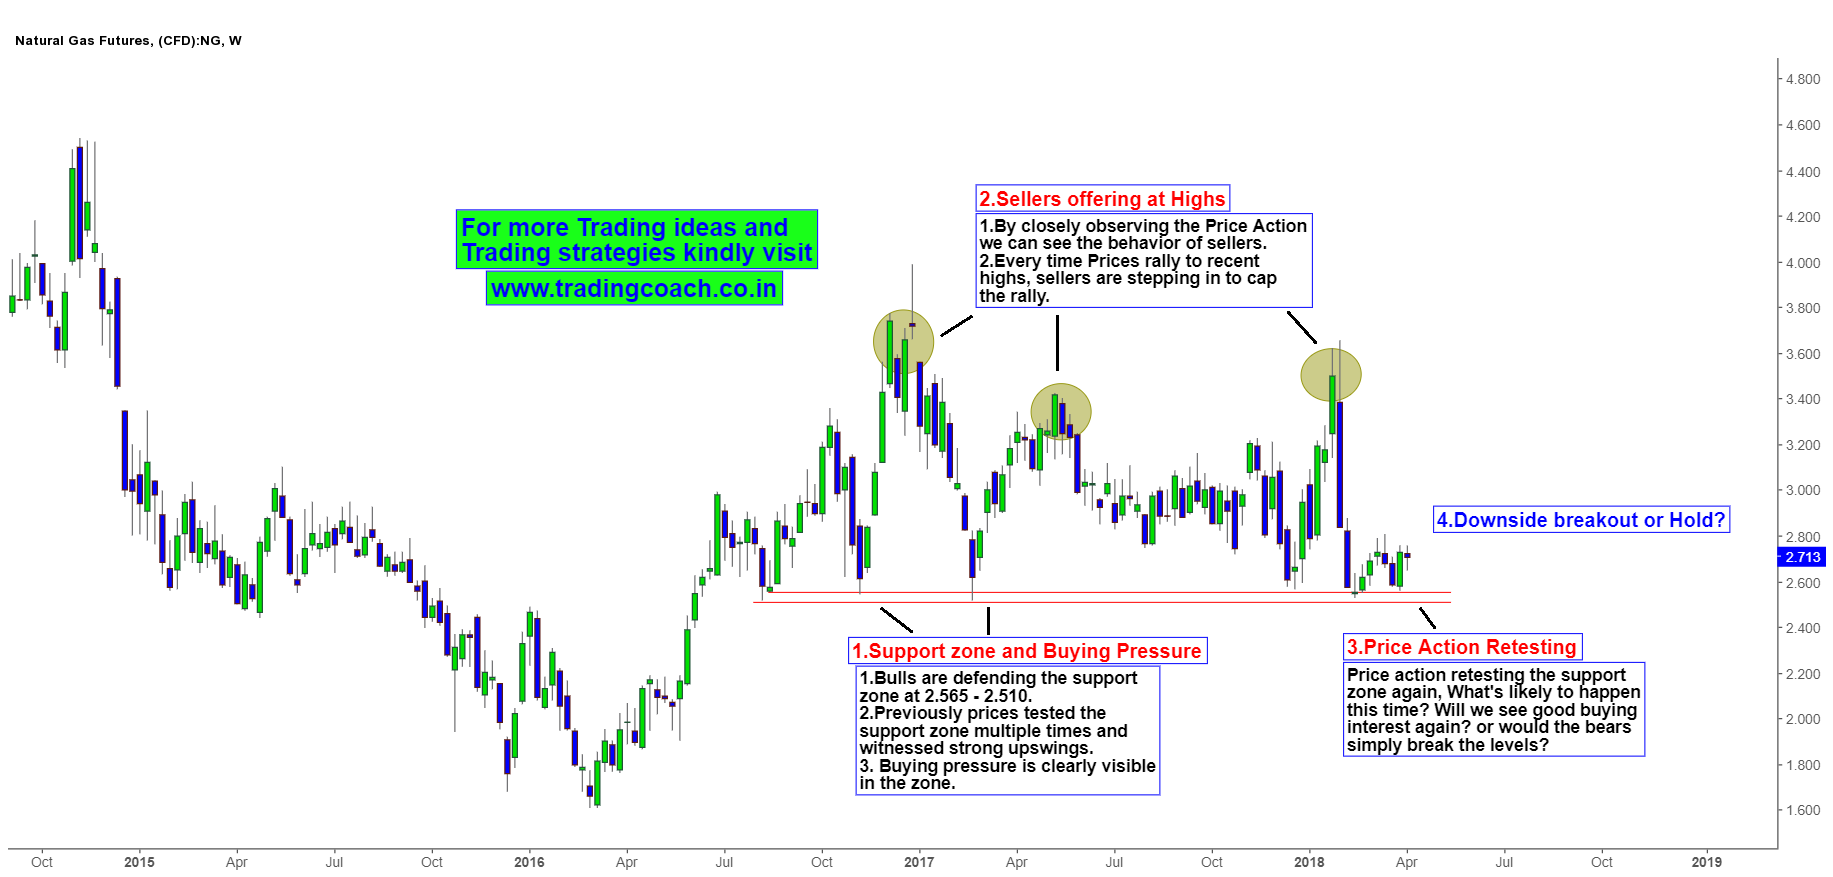
Right now the major support zone at 2.565 -2.510 is taking the spot light. Previously, prices tested the zone multiple times and saw sharp upswings. During earlier retests, there was good buying interest at the zone. Buying pressure is clearly visible on the zone.
Price action is retesting the Support zone again, there are two possibilities this time – Either the Prices may break the support zone without much hassles or Buyers will step in again to defend the zone.
In terms of Fundamentals, EIA is forecasting a decline in Natural gas consumption due to warm weather in US. The push for electric vehicles and increasing environmental awareness is also hurting the NG demand from major European countries. Also according the report, Supply is still flat without much change.
Hence, looking from the perspective of Market sentiment, Downside breakout seems more likely. Traders must be cautious as geopolitics and other factors can bring back the buying pressure. Watch the developing Price action and Market structure then trade accordingly.


