

Nickel, just like other base metals, had an average performance since the beginning of 2018. Based on MCX prices, metal’s value rose from 750 in the month of Jan and touched 1000 in April. Overall Market sentiment and perception is optimistic in Nickel, but it may change if the recent fall turns into moderate correction. Since last couple of days, Nickel prices tumbled from 1070 (which is the high) to 950. It’s currently trading somewhere around 940.
Nickel Price Action Analysis on Daily chart
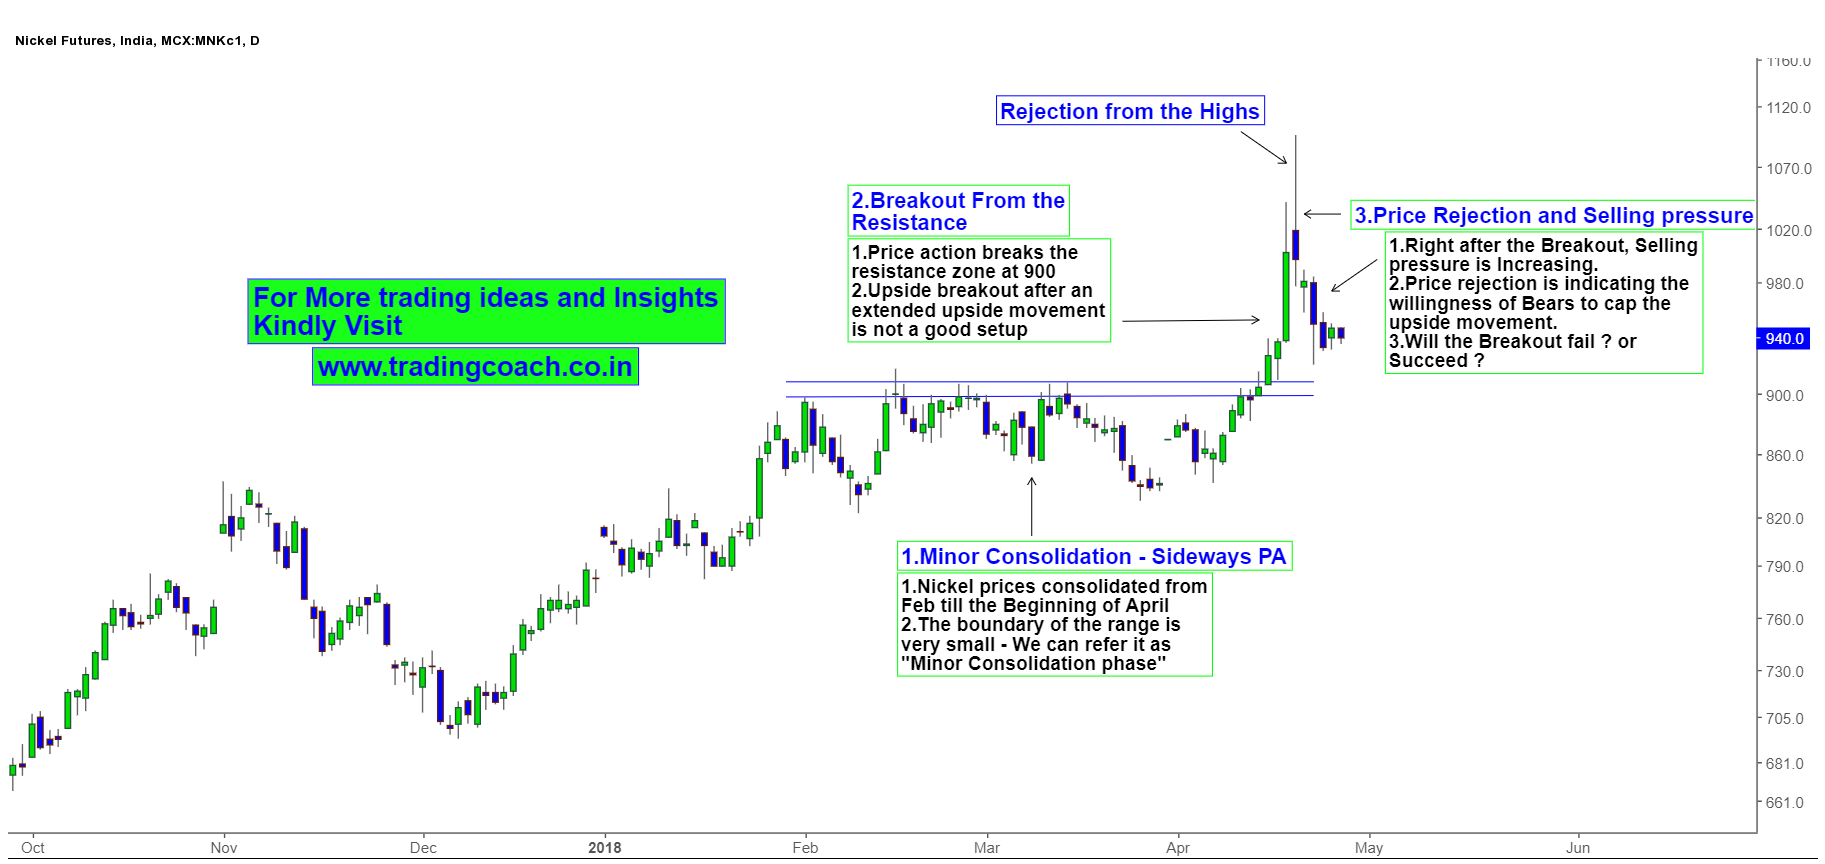
From Feb till April, prices were consolidating in a tight range between 930 – 850. Market formed structural resistance zone at 900 – 930. The size of the range was pretty small; it took place within the Uptrend structure. Some professional traders usually refer to these types of ranges as “Minor consolidation” or “Trend based consolidation”.
Then in Mid-April price action broke the resistance zone at 900 – 930. There are two important factors about this breakout 1) It’s a bullish breakout after an extended uptrend 2) The breakout is likely a result of Weak hand traders. Based on statistics, breakout in same direction of the overextended trend is not a good setup.
Right after the breakout we saw a sharp Price rejection from 1000. It’s an sign that sellers are pushing the prices down. Bulls must clearly break and retest the psychological round number 1000, to trend higher. If we see further increase in selling pressure then Breakout might fail. Traders should keep an eye on Price action and take trades accordingly.


