

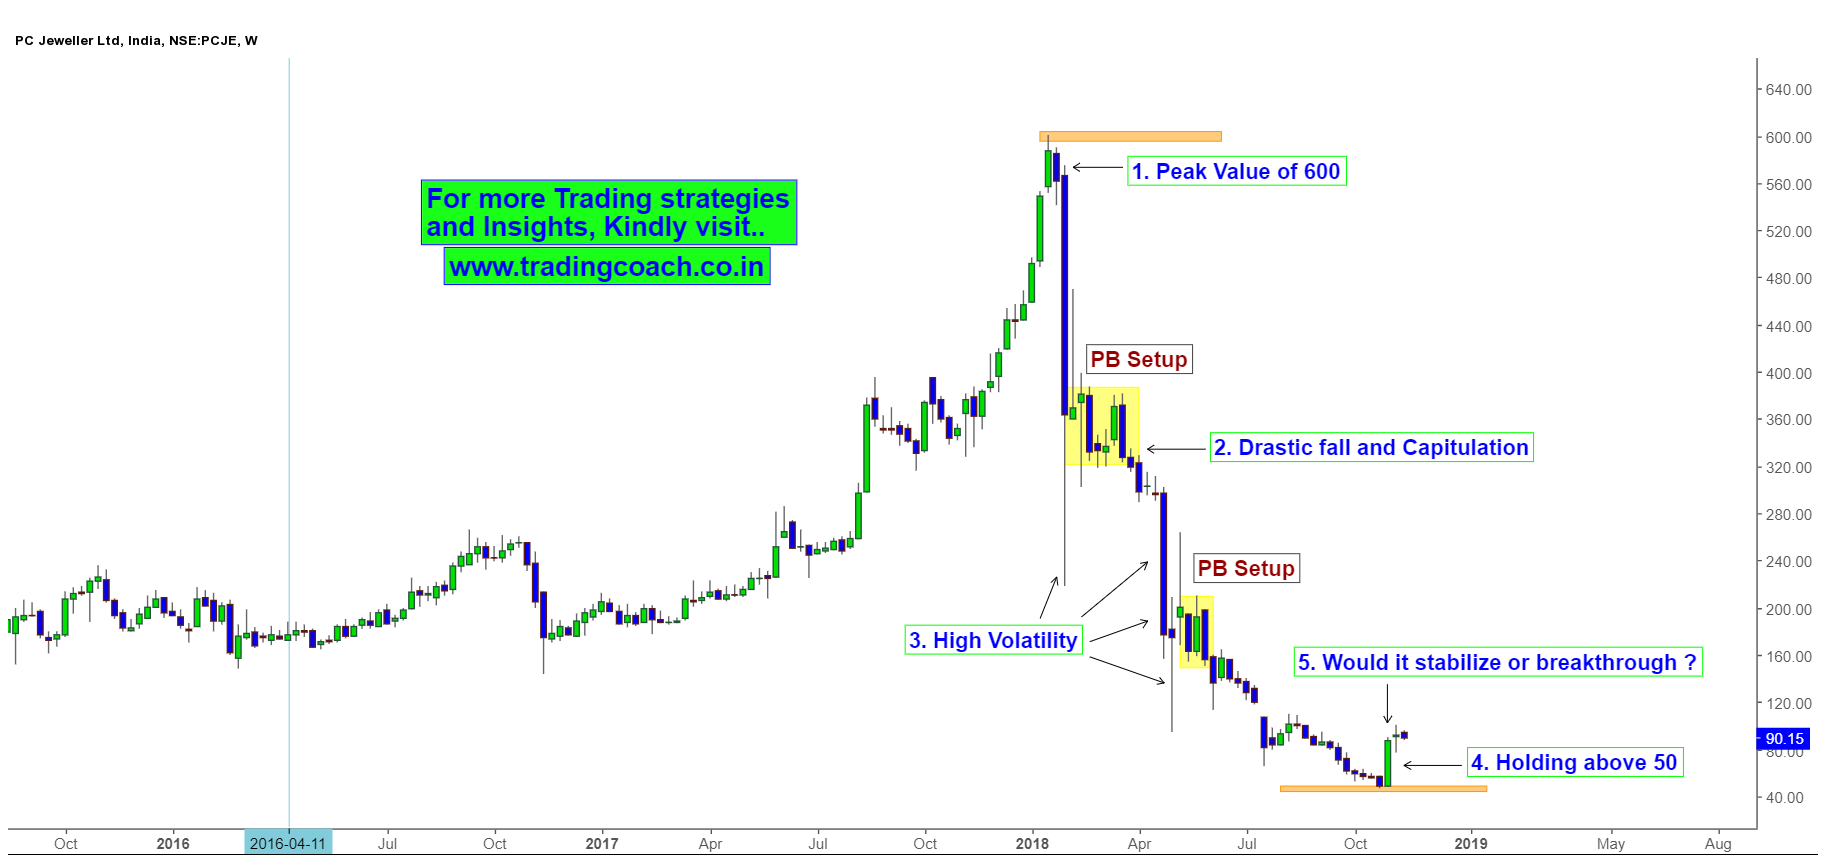
Surprises in stock market happen every once and then. This time, it’s all about PC Jeweller share prices. Since the beginning of 2018, stock prices declined all the way from 600.00 to 50.00 per share. The strong bearish grip and volatility spooked out many potential investors in first stages of market decline. Once the shiny jewellery stock, turned into no man’s land in a very short time. Have a look at the weekly chart to get a sense of PC Jewellers Long term trend.
Long Term Price Action Analysis on Weekly chart of PC Jeweller Share prices
But from last couple of weeks, we could witness an extreme short covering rally on 4h chart. After testing the low around 50.00 – 47.00, a strong impulse move emerged from the low. As stock prices climbed higher, traders with short positions liquidated aggressively. The entire liquidation process turned into a short covering rally.
Impulsive Movement and Short covering rally on 4h chart of PC Jeweller Share prices
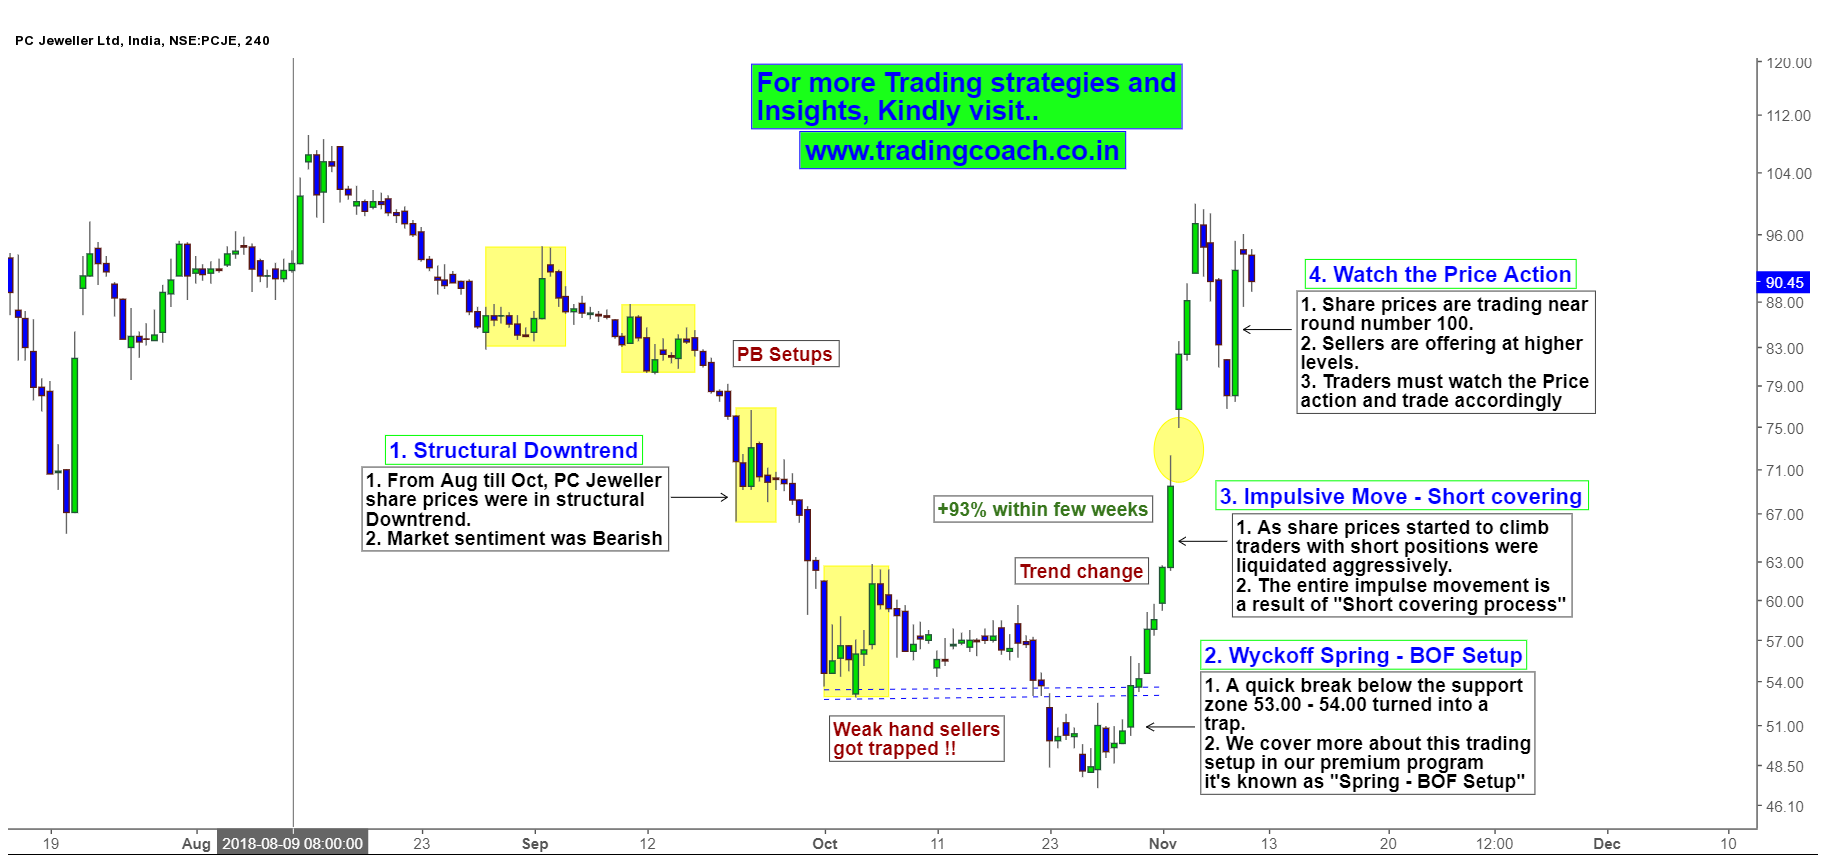
Right now, share prices are trading around round number 100.00 and traders should watch the price action around this zone very closely. Developing market structure or formations will offer good trading opportunity in coming days. Even though we see buying interest on lower time frame, the long-term trend is still down. So while initiating any trades, it’s better to follow a proper risk management strategy.


