

When I infer price action through candlestick patterns, often traders misunderstand and conclude that “I am talking about candlestick patterns”. Fancy names such as Pin bars, Shaved bars, Engulfing patterns are referred to recurring price action candlestick patterns. These kinds of names to candlestick structure are often misleading. They’re treated with hard- fast rules and traded like mechanical trading signals. The Joke is, some call it price action trading!!
MISLEADING INFORMATION ON PRICE ACTION AND CANDLESTICK PATTERNS
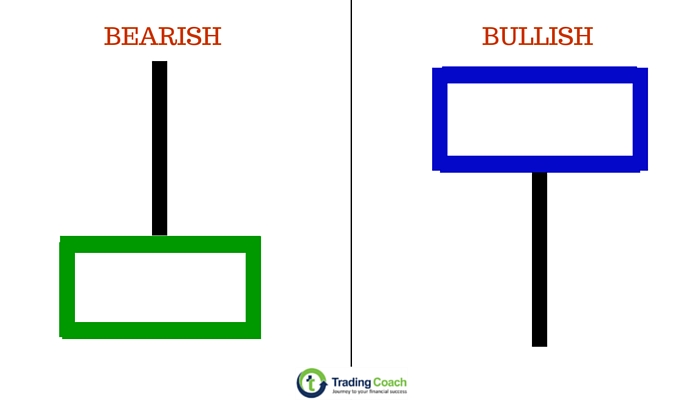
Internet is full of this misleading information which tricks people into thinking that price action trading is similar to identifying candlestick patterns. One common example is Pin bar. If you’ve some idea about price action trading, then you could’ve come across this simple and often misunderstood candlestick pattern. Pin bar have become a parody of Price action trading. Some people even say, price action trading is all about trading pin bars!! Trading pin bars based on hard and fast rules is not price action trading; it is pattern trading and has no value for a practical trader. Pin bars randomly appear around key levels; it neither has any trading edge. Trading edge is important for trading success, Read more about it here…
LIMITATIONS OF CANDLESTICK PATTERNS
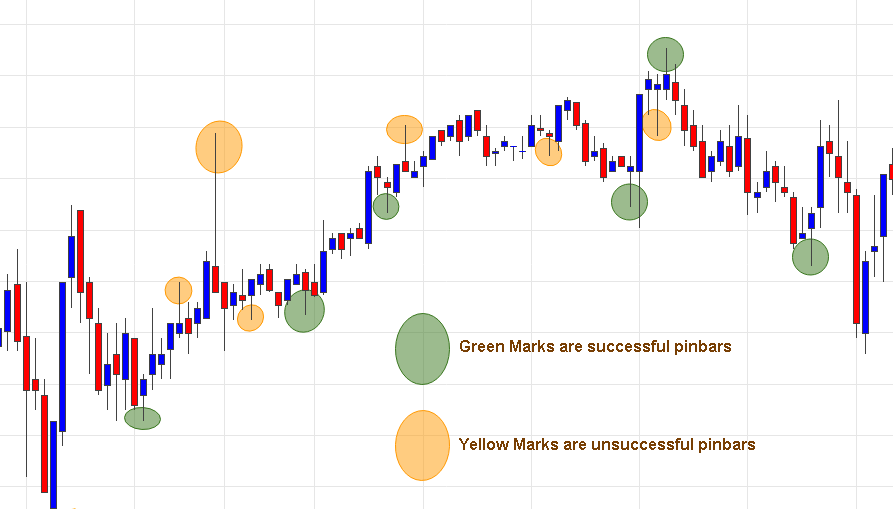
Trading candlestick patterns has clear limitations. Randomness, Inconsistency and low probability are few important issues in practical Trading. Thinking of Price action candlesticks as mere pattern trading is a recipe for disaster. Precisely, this is happening in online forums and informational websites. Candlestick patterns, unlike price action patterns, should be analyzed through background of “buying and selling pressure”.
We can overcome these limitations by reading price action inside candlestick patterns. This will help us to check the buying and selling pressure inside candlestick patterns. Doing so, will lead us to focus on high profitable candlestick patterns and avoid low probabilistic ones. How to read price action inside candlestick patterns? Read on to know how..
READING PRICE ACTION INSIDE CANDLESTICK PATTERNS.
Reading Price action is a powerful skill. One of the concepts in Price action is to look at candlestick patterns on a chart and analyze, “what kind price action might have created the candlestick pattern”. In laymen terms, this means being able to look at candlestick patterns on one timeframe and immediately understand, most likely lower timeframe scenarios that could’ve created candlestick patterns. Consider this example
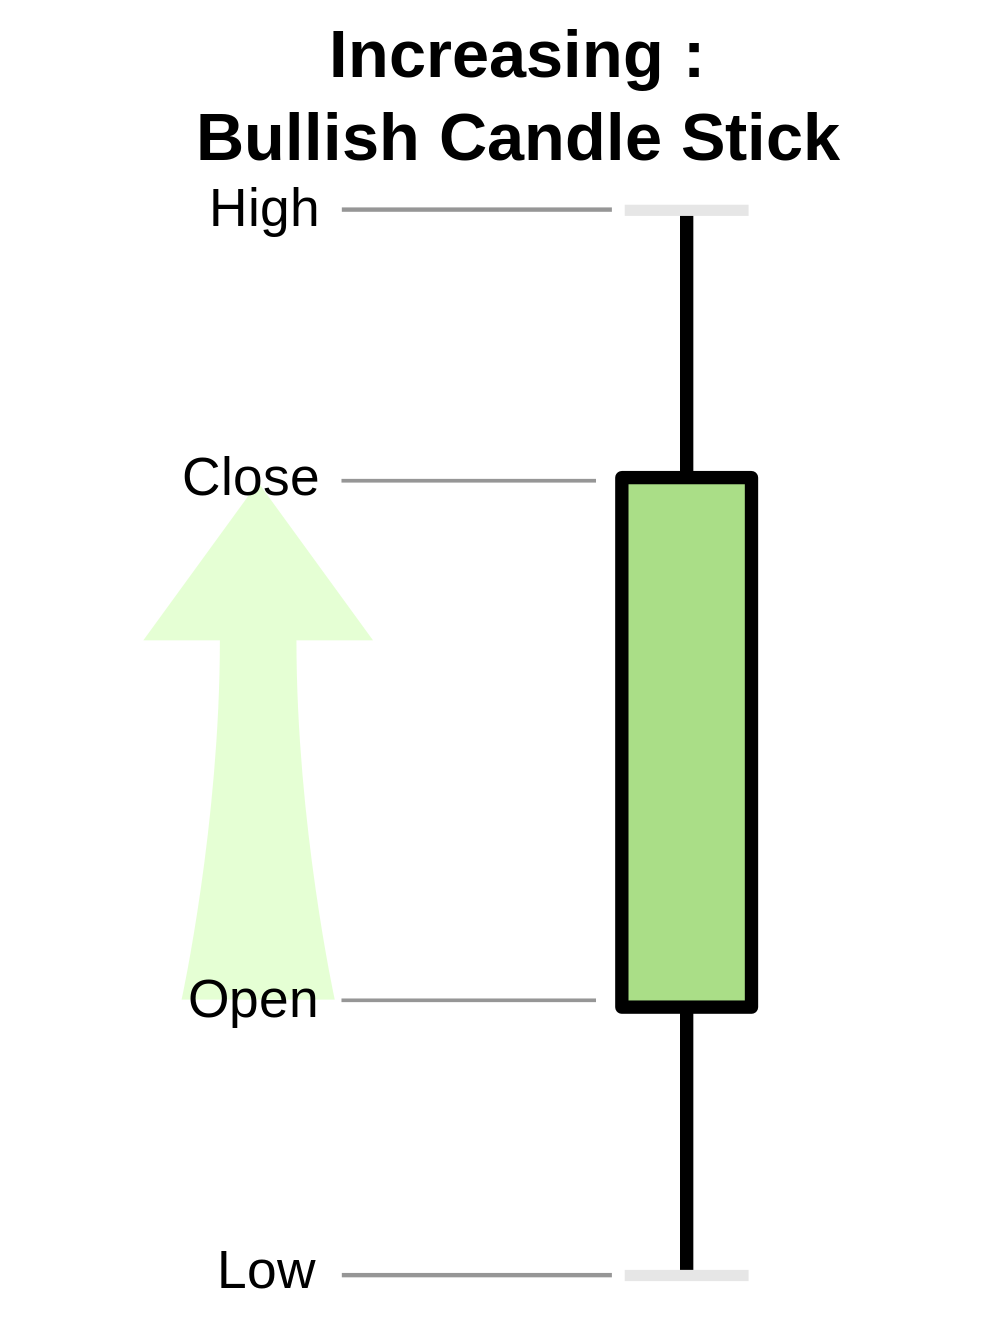
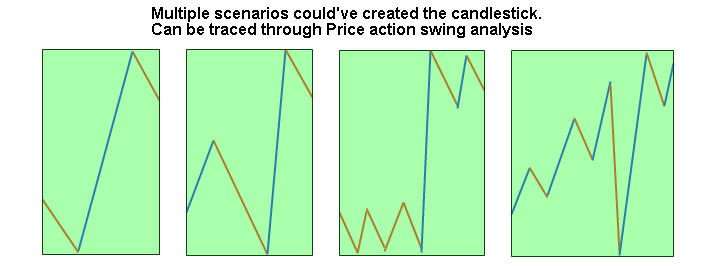
In the picture, we can see a single candlestick with moderately small shadows on top and bottom. If you’re an experienced trader, then you can say few things about this candlestick. The close is higher than the open. Price action formed the lows, and it traded higher than the close. Finally, it rejected back from the highs. Simple isn’t it? Wait, There’s more it. Perhaps this is just a tip of an iceberg; there are multiple possibilities on how price action could’ve formed this candlestick. Traders developing a sense for price action need to spend time identifying lower time frame scenarios that could’ve formed the candlestick. We can do this with help of applying Price action swing analysis on lower time frames.
Price action swing analysis is a method of analyzing market structure. Read More about it here…
Being locked in a single timeframe without considering the whole picture can blind us from understanding the market’s reality. Even though lower time frame has random noises and volatility, there will be circumstances, where lower time frame market structure becomes very important. Analyzing price action through lower time frame scenarios helps, to avoid low probabilistic candlestick patterns.
A VALUABLE METHOD TO FILTER OUT LOW PROBABILISTIC TRADES.
Traders need to develop the skill of understanding lower time frame scenarios, of candlestick patterns. It will increase trader’s intuitive grasp of Price action. It’ll help us to test candlestick patterns through the context of buying and selling pressure. Once we know the buying and selling convictions behind candlestick patterns, we can filter out low probabilistic trade entries.
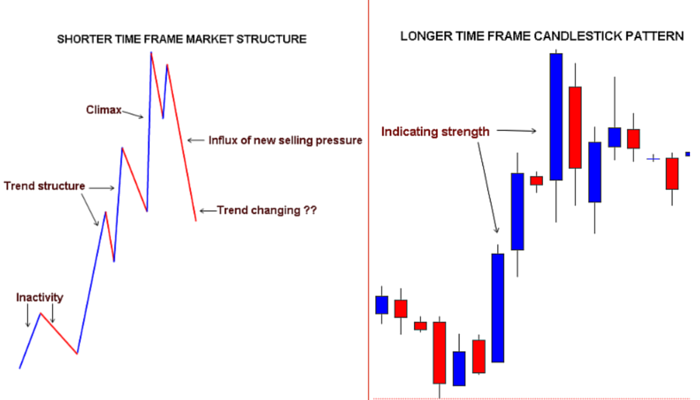
Visualize the picture above in the left panel, it’s a lower time frame market structure, which is traced through swing analysis. Compare that with corresponding higher time frame candlestick patterns in the right panel. At first glance, without any reference from lower time frame scenarios, the candlestick patterns on higher time frame looks strong. A deeper analysis with lower time frame reveals important information about pattern’s strength, through the prism of buying and selling pressure. Many traders after looking at large candlesticks assume, it’s an sign of strength. But from the perspective of Price action, this is often a short-term exhaustion or even a slight reversal.

1 thought on “Analyzing Price action in candlestick patterns – A skill to overcome limitations”
nice information abt candlestic and price action