Alright, so most of us are already aware of the Story that’s driving the market prices. FED hikes the interest rates, all global indices just tipped to red zone!
Not just Nifty 50, global markets including S&P 500, NASDAQ, FTSE, DAX etc. are all in Red. So what’s going to happen next? Well it all depends on the sentiment…
As a trader, it’s better to ignore the noise and focus just on the Price Action. Price Action reflects the market sentiment, so instead of predicting the market crash or hoping for the next Bull Run, watch the market behavior on higher time frame and take clear decisions.
I have already pointed out the big picture outlook of Nifty 50 in my content earlier, here’s the recent Price Action outlook and update.
Nifty 50 – Price Action Trading Analysis on 1W chart
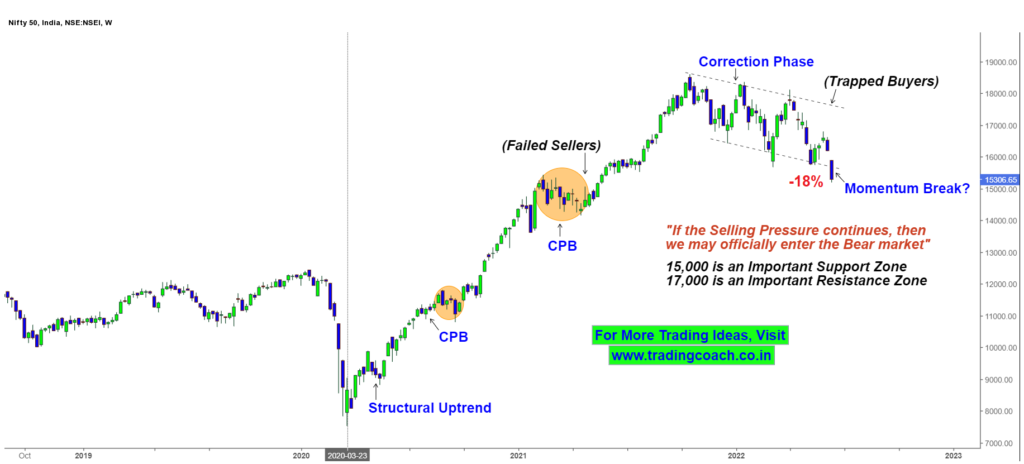
It’s easy to see that Nifty 50 in Correction phase. Prices have tested and broken the Parallel Support zone around 15300.
Based on Momentum, so far Nifty has declined around 18% from the peak value. Not much of a fall, when compared to the historical market crashes.
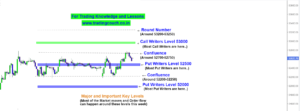
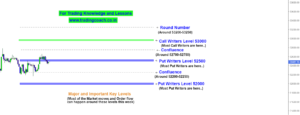
15,000 is an important support zone, if that cracks, we may see more downside in Price Action. 17,000 is an important resistance zone, prices have to break above this level, in order for the sentiment to turn around.
If the selling pressure continues further, we may officially declare it as Bear market. In all other cases, it’s likely to stay in the correction phase. Traders Keep an eye on the Price Action and take trades with proper risk management.
Checkout the Video link to learn more about Bear Market Trading strategy