

Base metals are the talk of the town for this year. So Far, silver is following footsteps of Gold as Price action is trading within corrective market structure. Intermediate trend is still intact within the Markup phase. US Economic head winds, FED, Global demand are the prime movers influencing the investor sentiment. Recent Price action in Silver is showing the cautious nature of speculators. Current Price value of silver in spot market is 16.45.
Below is the daily chart of Silver with Price action analysis.
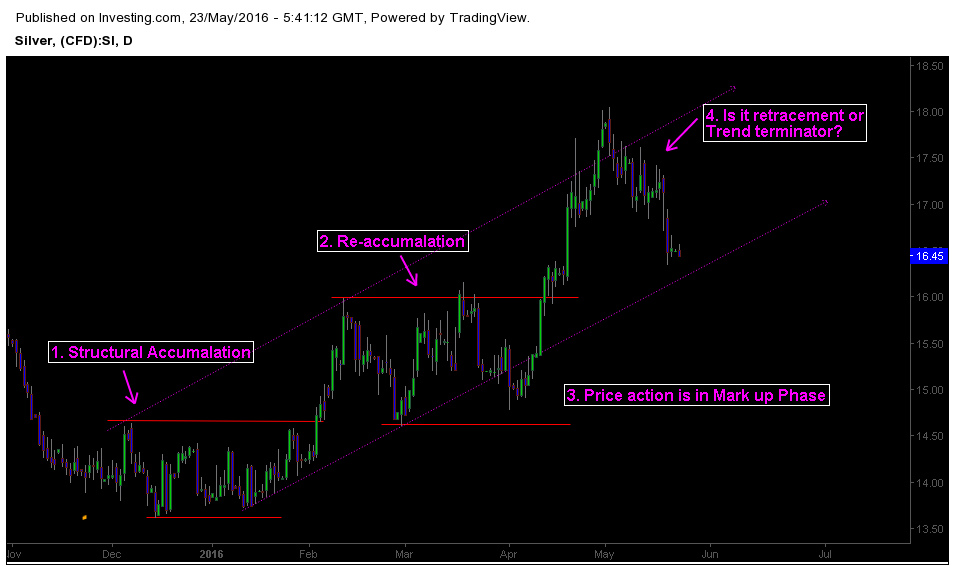
1. It all started with Structural Accumulation
Price action in Silver is quite clear and easily analysed with Richard Wyckoff’s market cycle. Compared to Gold, Silver provides an accurate view of present market structure and trend in Overall base metals. Price action started marching higher from January 2016, but it all started with a structural accumulation on December 2015.
2. Re – accumulation and shakeout of Weak Hand Players
Some interesting developments took place when silver stalled at 16.00. Price action traded in a rigid range bound structure for a while. Liquidity and Positioning factors are main cause of the movement. Wyckoff referred to such movements as re-accumulation which resulted in shakeout of weak hand players.
3. Price action is on Markup phase in Daily chart
From the perspective of Daily chart, Price action is in markup phase. But it is worthwhile to consider weekly chart that seems to indicate a different structure altogether. Multi timeframe analysis can help us to see big picture and avoid single point of reference. It also increases the odds of a trading edge.
4. Is the current price pattern a regular retracement of Trend termination?
Retracement leads to continuation of earlier trend whereas termination stops the previous trend. It is important to note that termination pattern just stops the previous trend, but doesn’t indicate any reversal signs. It means trend can temporarily move into a range bound structure or turn into a reversal. Retracement on the other hand signs the continuation of previous trend. Traders should focus on price action to properly infer the structure. Also keep an eye on Lower time frame key levels.


