

From last couple of Weeks, Most of the stocks are exhibiting a tendency for either trend continuation or Trend reversal. My previous two articles were also based on Trend analysis. This time it’s about the downtrend in 4h chart of India’s largest public sector lender – SBI or State Bank of India.
SBI Price Action Analysis on 4h Chart
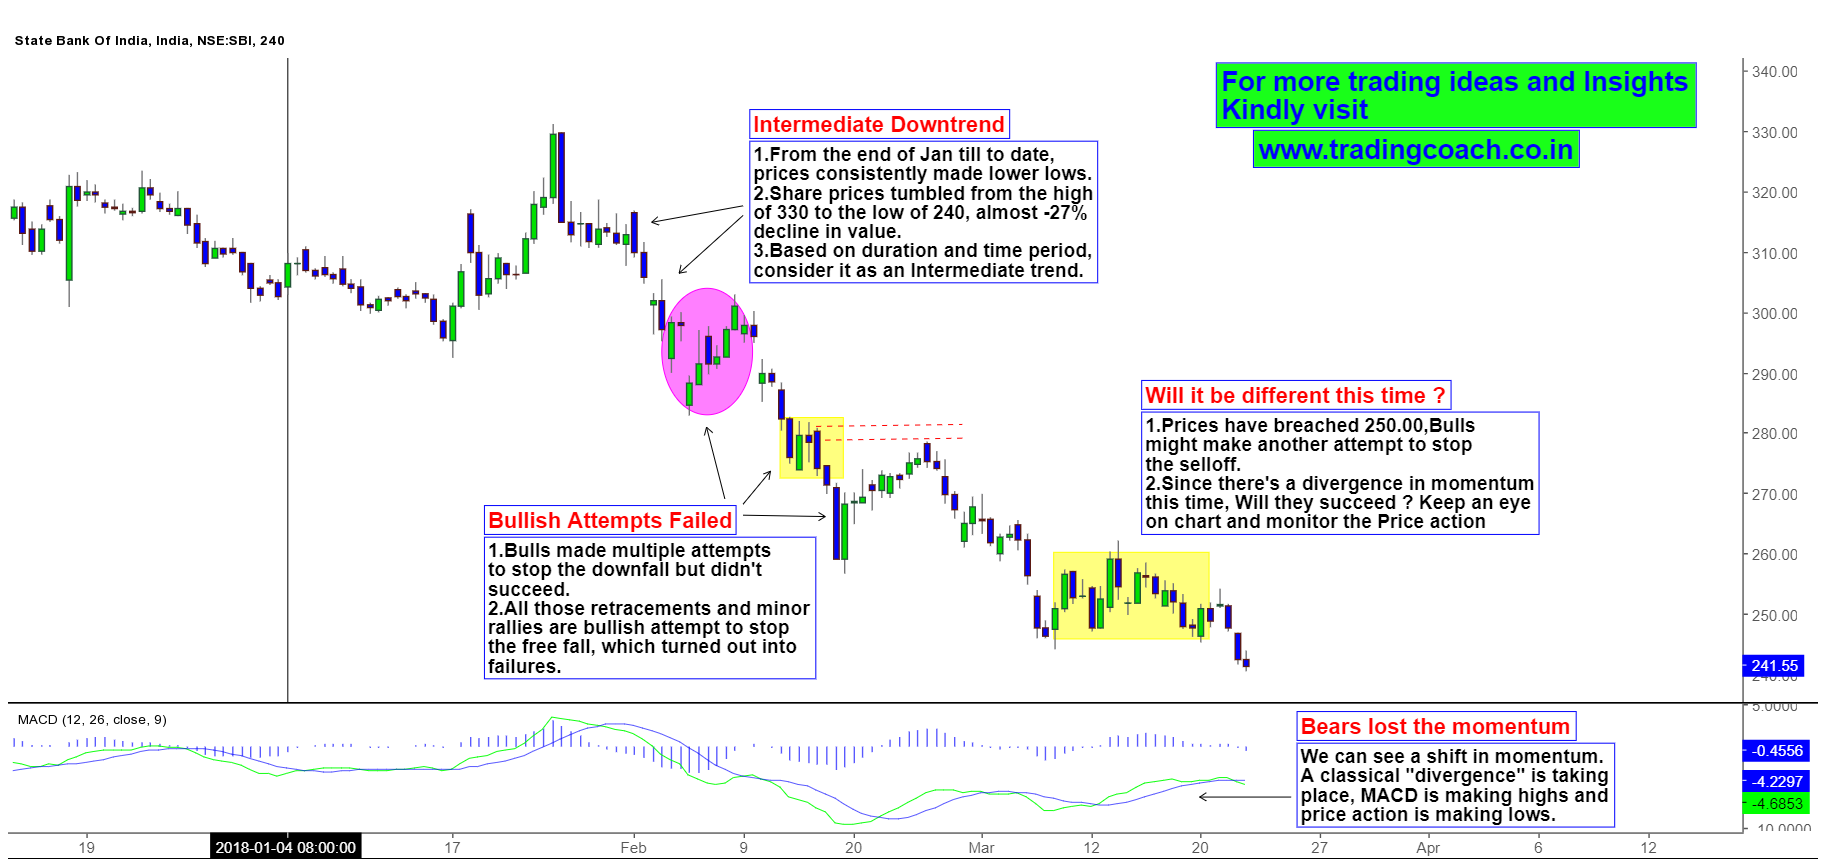
From the end of Jan 2018 to till date, SBI Share prices tumbled consistently. Stock values declined from 330 to 240 within less than 3 months. That’s almost – 27% decline in terms of Market value compared to Bank nifty which only lost -13% of its total value. Since time duration of the Trend is less than 3 months it’s an Intermediate down trend (from the perspective of Dow Theory).
In the current situation, even though Prices are making lower lows, Momentum is showing a divergence (measured through MACD). Technically, this means Bears are losing the strength. Consistent selloff of shares without any major retracement has exhausted selling pressure from the market. Does this means prices can bounce up in short-term? As you can see the chart, Bulls have made multiple attempts to cap the downtrend previously. But those attempts turned into failures. Will the bulls succeed this time? Or will they fail just like the previous attempts. Traders should observe the chart and monitor developing price structure for answers. SBI Price action will be interesting to watch in coming days.


