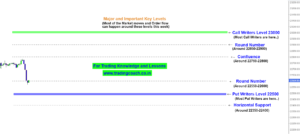
Since from the First week of October, Tata Motor Stock Prices are struck in a Range
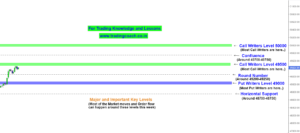
Prices are moving between the levels of 530, which is a respective Resistance Zone and 450, which is a respective Support zone. When we look at the 4h Chart, we can notice the Structural Range bound market behavior
Tata Motors Stock Prices on 4h Chart
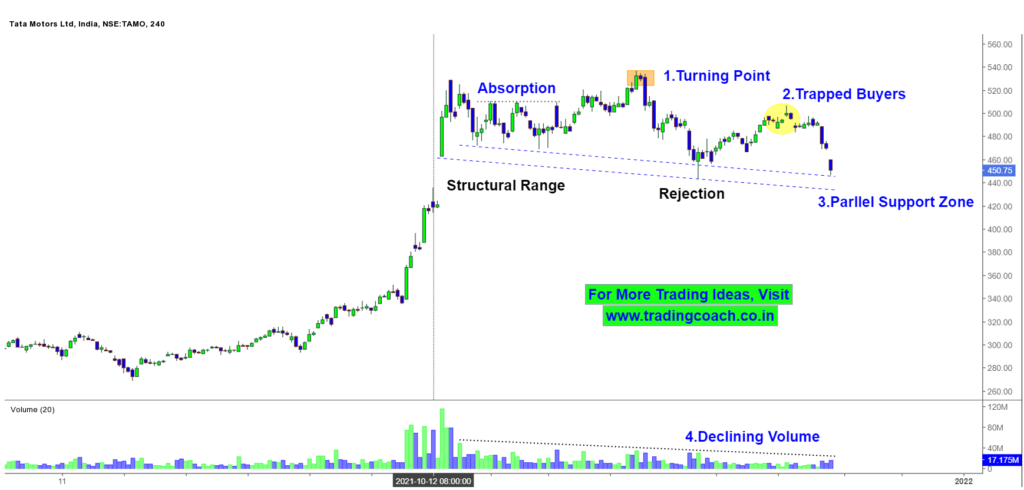
Uninformed Buyers and weak traders who bought the stock during the period of 29th November to 13th December are trapped within the market.
The Parallel Support Zone is around 430 – 440. Price Action is testing the Parallel Support Zone now. Apart from that, we can also notice the Declining Volume since from the beginning of Range bound Market Structure.
If Prices breaks the Parallel Support Zone and retests it, we can see further downside in Tata Motor Stock Prices. On the other hand, if Price Action holds at the Support Zone with good Buying Pressure and Momentum, we can expect the Stock Prices to shoot up.
Traders should keep an eye on the Price Action on 4h Chart and take positions accordingly. Also beware of the overall market outlook and Volatility in Stock Prices.