

USD/INR is one of the mostly traded emerging market currencies. Stringent geopolitical events and economic reports are dominating global Forex markets. Recent Price action in USD/INR is moving antithetical to earlier market sentiment. FED is the main conceptual influence on investors’ behavior. Current Price value of USD/INR is 67.26
Below is the 4h chart of USD/INR with price action analysis.
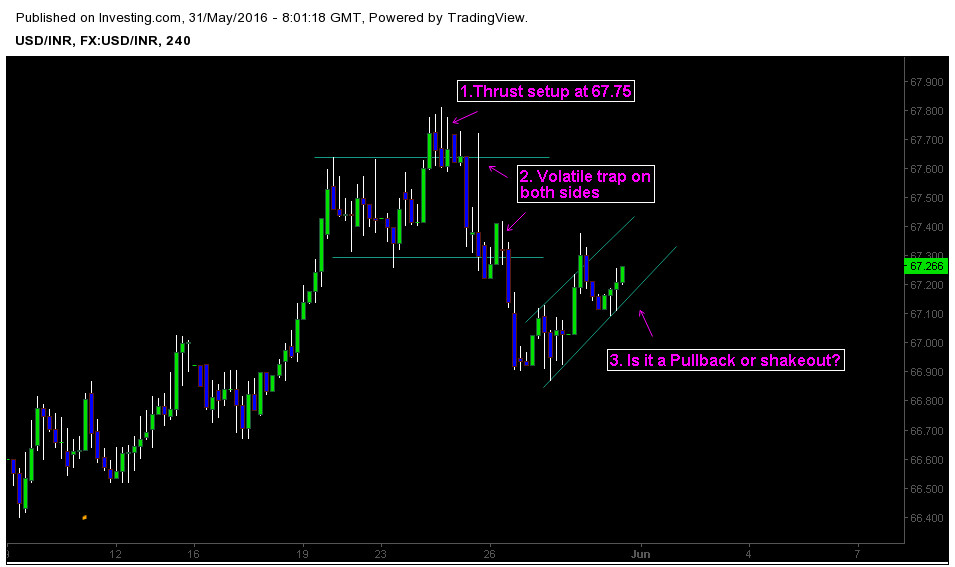
1. Thrust Setup at 67.75
We can see Wyckoffian Up thrust at resistance level 67.75. Price action turned down from that specific point leading to 87 pips retracement. It indicates the nocturnal tendency of positioning factors causing influx of selling pressure. From lower time frame the structure shows the distribution characteristics.
2. Volatile trap on both sides
An interesting development within this structure is the trap that occurred before the break of support level at 67.30. Large shadow and pre breakout formations signal the volatility within the structure. Market trapped both buyers and sellers before falling down.
3. The recent Price action setup
Currently price action is forming a setup although it’s a bit complicated pattern. From one perspective it seems like a pullback, on the other side it indicates a shakeout structure. For better clarity and opportunity traders should focus on developing price action around the pattern. Also keep an eye on higher time frame charts.


