Yes Bank is one of the crazy stocks which often have a consistent behaviour of moving sharply and then reversing back after trapping uninformed traders and public investors.
Within the last couple of days, stock prices shot up by nearly 40%. Prices moved from 17.00 to 24.00 in a matter of few days.
Price action wise, we can see a strong breakout from the resistance zone, which was at 18.00. Stock prices have clearly broken the resistance zone with strong momentum.
Take a look at the Price action on the higher time frame chart of Yes Bank.
Yes Bank – Price Action Trading Analysis on 1D Time frame
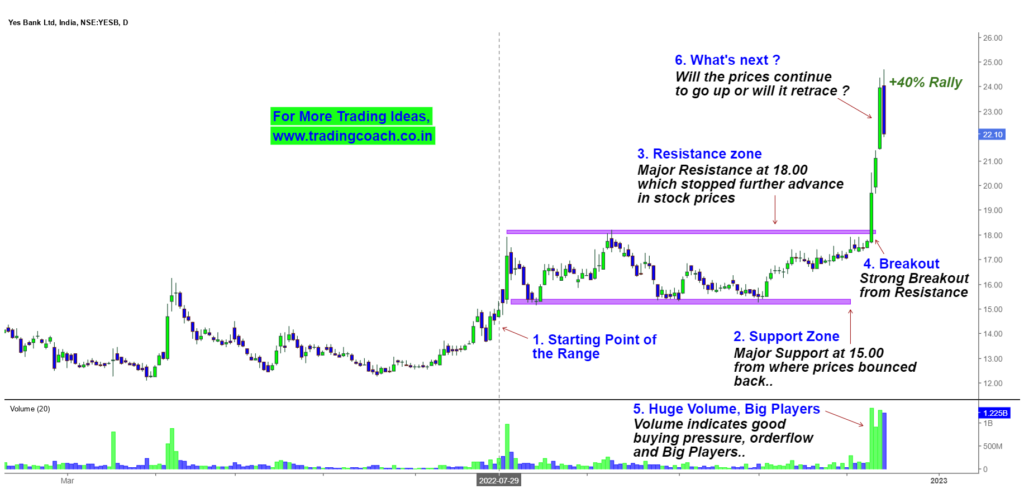
Observe the strength of the Breakout from Resistance zone at 18.00. The strong upside movement indicates powerful momentum and buying pressure on the stock.
Also, notice the peak in the volume. A huge and sudden increase in the trading volume reflects strong order flow in the stock.
The Volume also means some Big Players could be lurking behind the sudden increase in stock prices.
Right now, prices are retracing back. What will happen from here? Will prices fall further and trap the uninformed traders? Or will it go up further from here?What are your thoughts about Yes Bank? Leave it in the comment!
Checkout the Video link given below to learn about a simple trading strategy to trade stocks like Yes Bank.