Here’s another small banking stock that has defied the odds and market sentiment. So far, stock prices have gained by more than 100% in a few weeks
Punjab and Sind Bank, which goes by the ticker symbol NSE: PSB, was trading around 15.00 per share in the month of October 2022.
Fast forward to a few weeks, the stock prices have rallied sharply and now it’s around 30.00 per share at the time of writing this content.
Take a look at the Price Action Outlook on the Higher time frame chart, you’ll understand what’s going on in stock prices…
Punjab and Sind Bank – Price Action Trading Analysis on 1W Chart
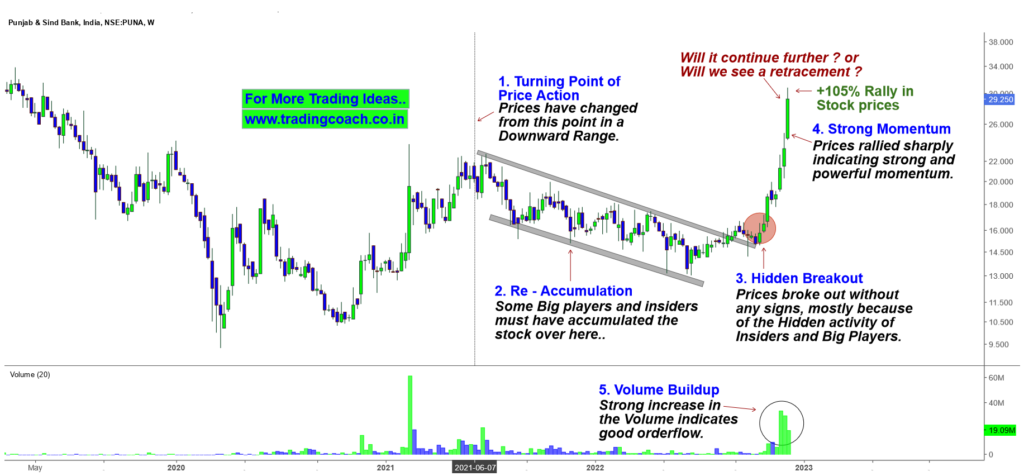
We can see a strong breakout from the Downward Range. Right after the breakout from the parallel resistance zone, which is around 16.00, prices shot up with strong upside momentum.
Precisely, stock prices rallied from 15.00 per share to 30.00 per share within a span of 7 – 8 weeks. That’s more than a 100% return in less than 2 months.
Prior to the Breakout, we could notice some signs of big players and insiders accumulating stock in the Re-Accumulation phase.
After the Breakout, we can witness a strong increase in the trading volume which indicates good order flow and buying pressure on the stock.
So will stock prices continue to go up? Or should we expect a reversal from here? What do you think about this stock? Leave it in the comments!
The Breakout in this stock was followed by Wyckoff’s Accumulation Phase. To learn more about this Wyckoff trading strategy, checkout the video given below…