There’s no doubt that many traders are literally clueless about what’s happening in Nifty. Especially those who’re trading in lower timeframe.
Overall, the market is still in the correction phase.
To get clarity and understand what’s happening with the Price Action, it’s better to look at the Big Picture on higher time frame charts.
Take a look at the Price Action on the Daily Chart
Nifty – Price Action Analysis on Daily Timeframe
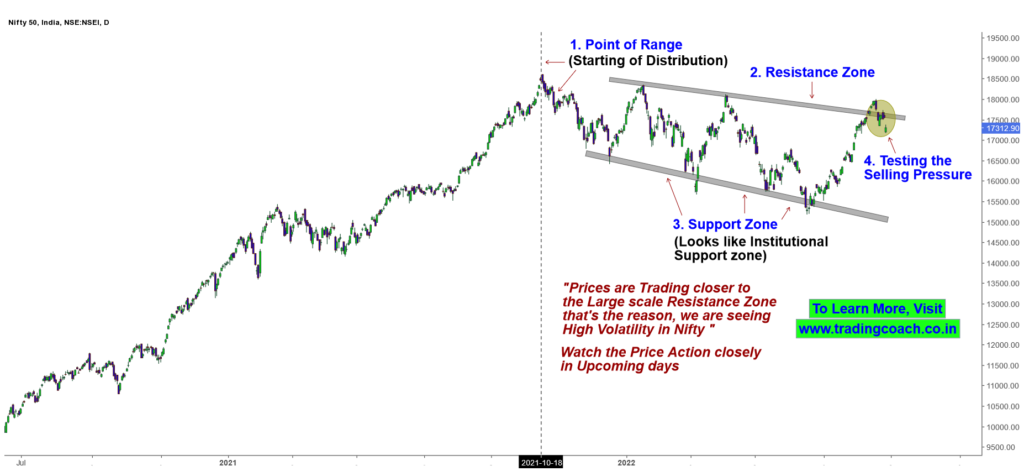
Prices are trading in a corrective range, since from October 2021. We are still within the Distribution Phase.
The important Resistance zone is at 17750 and the Support zone is around 15000. The Support zone is also an institutional level, where large orders might enter into the market.
Right now, prices are testing the Resistance zone. Since it’s a large corrective range, testing the large scale resistance could increase the volatility.
That’s the major reason why we are seeing high Volatility in the Nifty 50. Volatility is likely to increase unless and until a clear trend is established.
As we move into the coming week, Traders should be prepared to face more volatility and confusion in the market.
Watch the Price Action and trade accordingly. One possible trading setup which we can expect in such a volatile market is Wick Trap.
Take a look at the video given below to learn more about Wick Trap Price Action Setup.